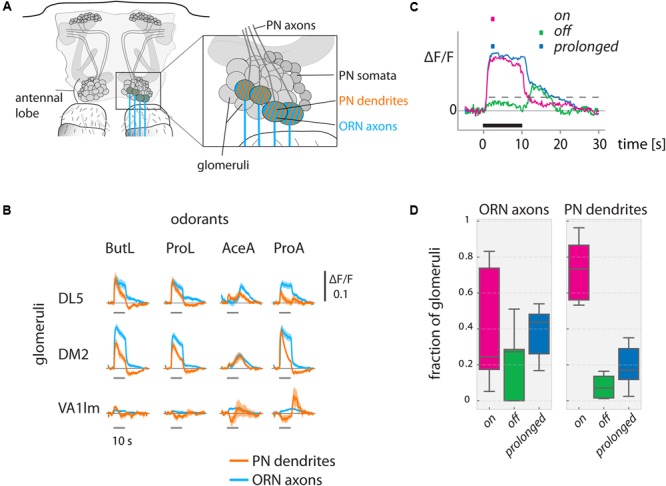
FIGURE 2.

Odorant-evoked activity in ORN axons and PN dendrites in the antennal lobe. (A) Schematic of the antennal lobe. ORN axons (blue) and PN dendrites (orange) were measured in olfactory glomeruli. (B) Ca2+ responses show odorant-specific dynamics. Ca2+ responses (ΔF/F) are shown for ORN axons (Orco-Gal4, blue) and PN dendrites (GH146-Gal4, orange) for exemplary glomeruli. Odorant stimuli were 10 s long. (DL5: N = 9 flies, DM2: N = 9, VA1lm: N = 5, mean with SEM). See methods for odorant abbreviations. (C) We categorized responses into on (only responding during the stimulus), off (only responding after the offset of the stimulus), or prolonged (sustained responses starting with the stimulus but outlasting it), based on response thresholds (see methods for details) during the marked time points (colored squares above the graph). Dashed gray line indicates the threshold (exemplary). Black line indicates the odorant stimulus. (D) Fraction of glomeruli in each animal responding with on, off, or prolonged time courses (N = 9 flies for ORN axons, N = 10 for PN dendrites; data pooled across animals, distribution across 6 odorants. Boxplots show median and quartiles, whiskers delimit 1.5 × interquartile range.) See Materials and Methods for number of flies and glomeruli.
