FIGURE 5.

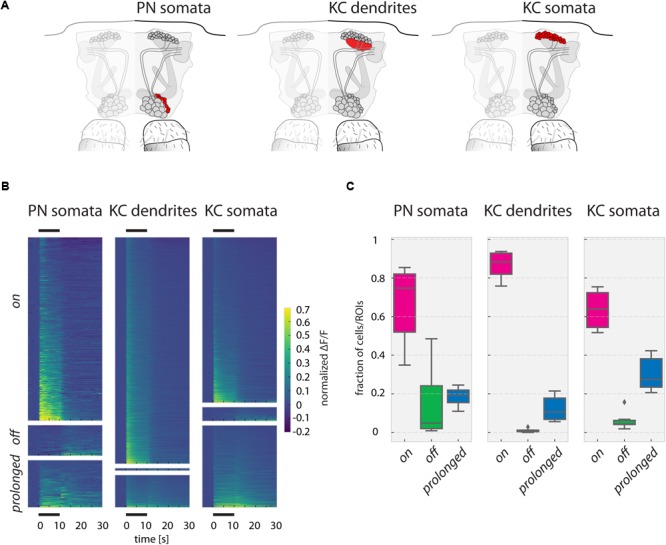
Responses to odorants in PN somata, KC dendrites, and KC somata. (A) Schematic of the recorded PN somata, KC dendrites in the calyx and KC somata layer in the fly brain. (B) Ca2+ responses (ΔF/F, normalized to the strongest odor response in each fly) of PN somata, KC dendrites, and KC somata of all measured odorants in all measured flies, sorted into on, off, and prolonged responses. Black bars above and below the graph mark the 10 s odor stimulus. (C) Fraction of responding units (somata or ROIs) per odorant in each response category for all three recorded areas. Prolonged responses are significantly more frequent in KC somata than in KC dendrites (p-value: 0.033). Boxes show the quartiles of the datasets, whiskers extend to show the rest of the distribution, outliers are marked as ticks. See Materials and Methods for number of flies and somata/ROIs.
