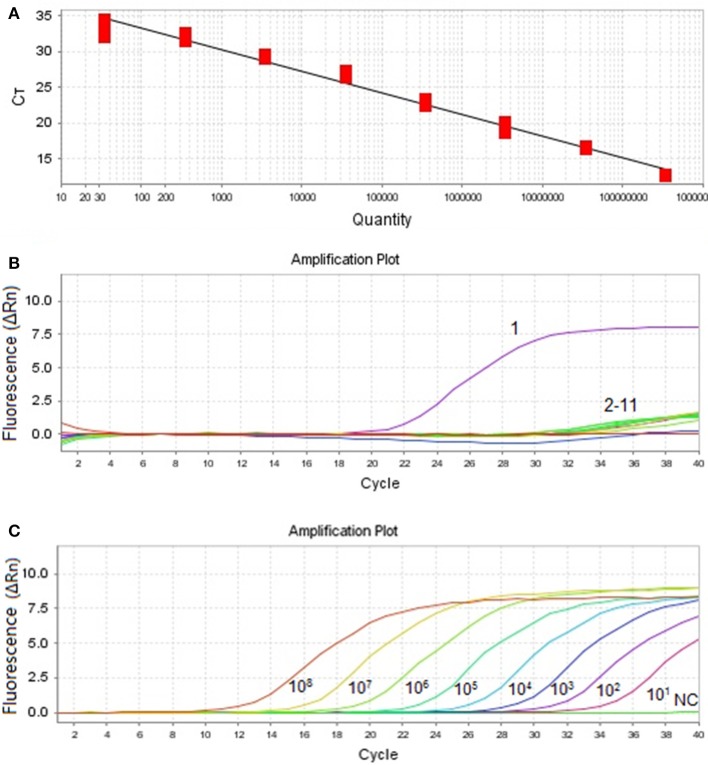
Figure 1.
Amplification curve and standard curve of MiCV. (A): Standard curve (Slope: −3.155, Y-Intercept: 39.202, and Efficiency: 107.447) was analyzed with the ABI7500 software. (B): Specificity of the qPCR. Ten other viral pathogens were used for the specificity test. 1: MiCV HEB15 strain DNA; 2–11: DNA and RNA samples of AMDV, MEV, CDV, PRV, MCV, CAV2, RV, PCV1, PCV2, DogCV, and H2O. (C): Amplification curves. Ten-fold dilutions of standard DNA ranging from 108 copies/μL to 101 copies/μL were used as standard controls.

