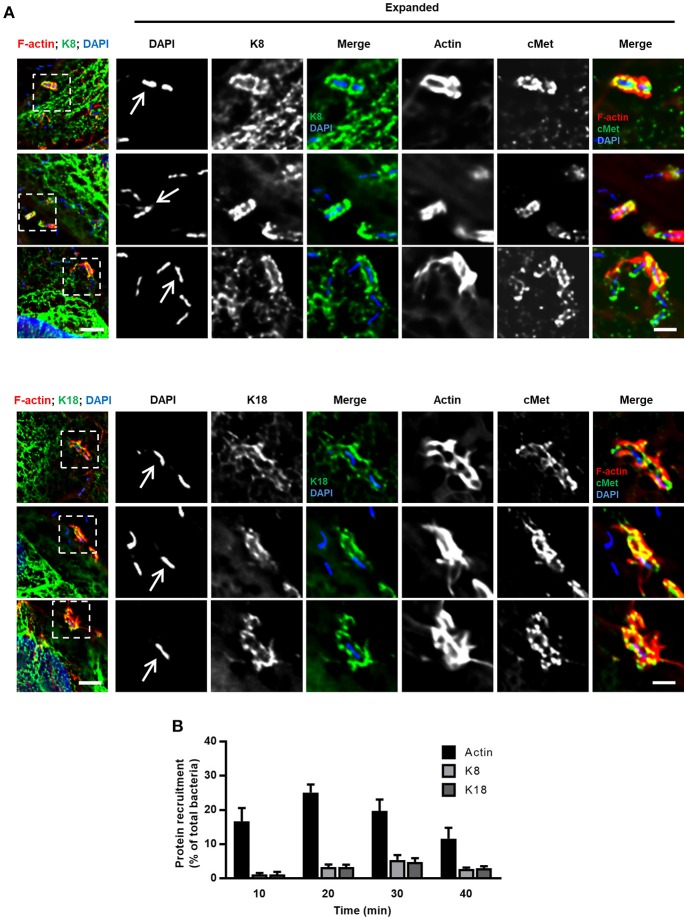
Figure 2.
K8 and K18 are recruited at the bacterial entry site during InlB-mediated cellular invasion. (A) Representative widefield microscopy stack projections of HeLa cells incubated with L. innocua InlB for 5 min, fixed and immunostained for cMet (green) and for K8 (upper panels, green) or K18 (lower panels, green). F-actin was stained with phalloidin (red), DNA with DAPI (blue). Scale bar, 5 μm. Arrows indicate bacteria that display accumulation of K8, K18, cMet, and F-actin at their vicinity. Insets show high-magnification images. Scale bar, 2 μm. (B) Quantification of K8, K18, and actin recruitments to the entry site of L. innocua InlB. Results are expressed as the percentage of total number of bacteria associated to cells. Values are the mean ± S.E. of at least three independent experiments.

