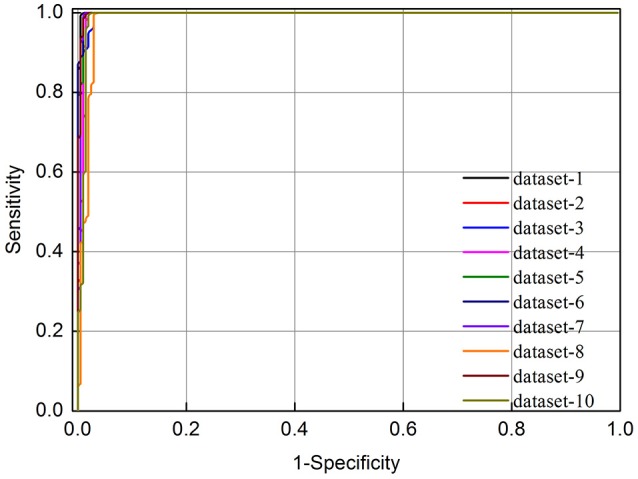
Figure 1.

The ROC curves of 10-fold cross validation test for identifying m6A sites in E. coli based on different negative datasets. The vertical coordinate is the true positive rate (Sn) while horizontal coordinate is the false positive rate (1-Sp).
