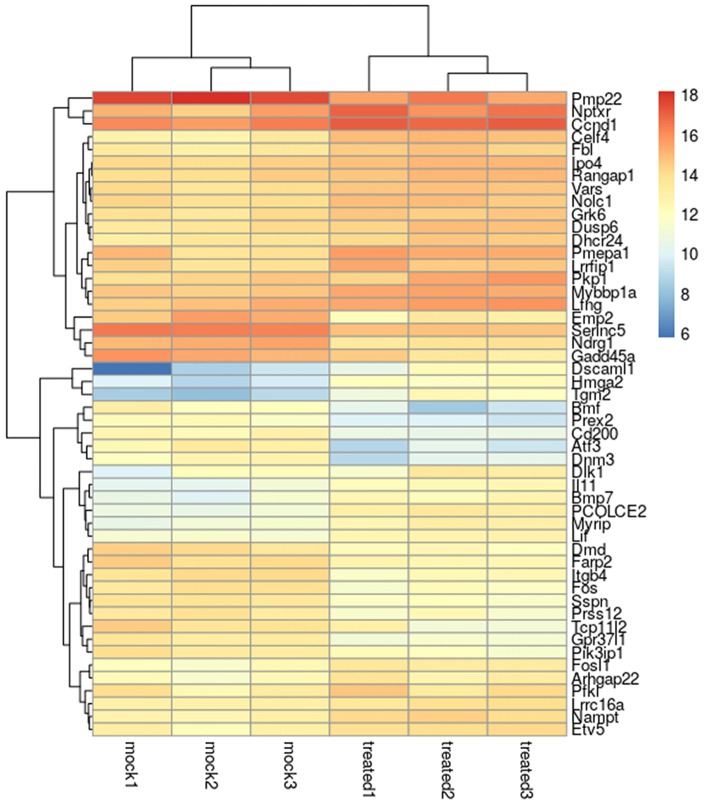
Figure 1.
Heatmap of the 50 most differentially regulated genes in Schwann cells. The heatmap shows the biological triplicate expression of the first 50 differentially expressed genes in Schwann cells stimulated with 10 nM NRG1β1 based on the obtained P value. “Mock” corresponds to samples treated with the vehicle, “treated” corresponds to samples treated with NRG1β1. Colour intensity reflects the expression level and represents the log2 (RPKM + 1) of the observed gene in each sample (RPKM, Reads Per Kilo base of transcript per Million mapped reads).

