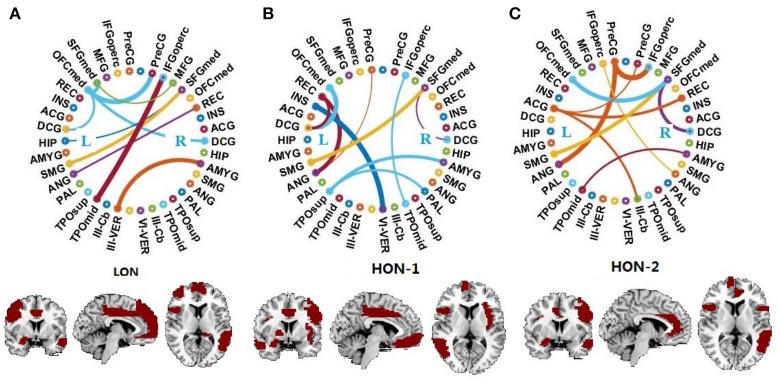
Figure 2.
Connectogram and involved brain regions of the top 10 discriminative connections selected by our framework in (A) the low-order FC network (LON), (B) the first-level high-order FC network (HON-1) and (C) the second-level high-order FC network (HON-2), respectively. The thickness of each line reflects its selection frequency, i.e., thicker lines indicate higher selection frequency. The brain slice view shows the involved brain regions (or ROIs). The brain slices were located at (−5, 4, 9) in the standard Montreal Neurological Institute (MNI) space. For the abbreviations of brain regions, please refer to Table 6.

