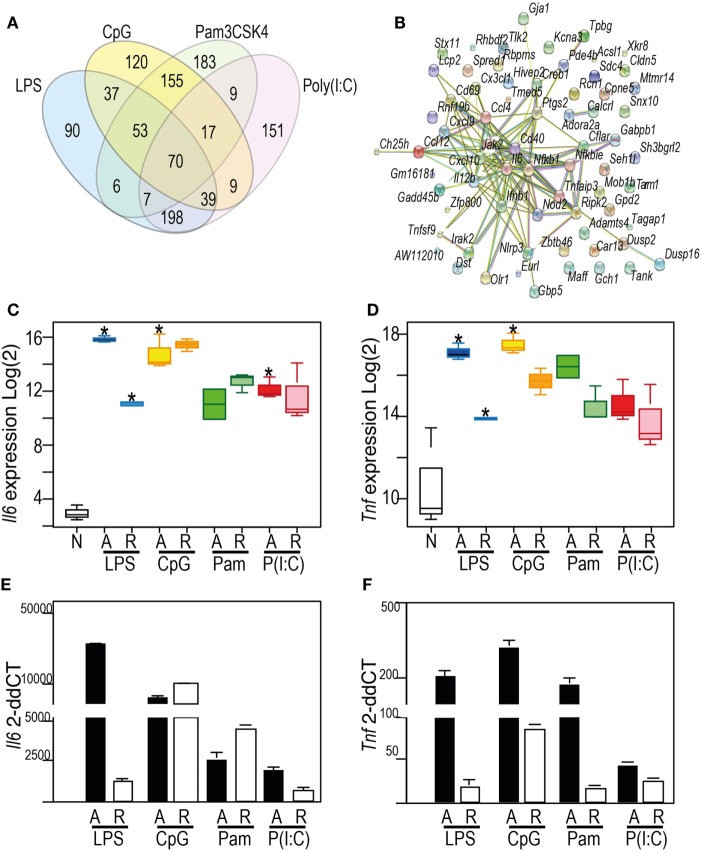
Figure 2.
Toll-like receptor (TLR) ligands acutely activate macrophages, with shared classes of inflammatory response (A) Venn diagram showing the overlap of the top 500 inducible genes in the acute (4 h) response to: 100 ng/ml lipopolysaccharide (blue), 1 µM CpG (yellow), 100 ng/ml Pam3CSK4 (green), 10 µg/ml Poly(I:C) (red). (B) Protein–protein interaction network derived from StringDB for the proteins encoded by the 70 genes commonly induced by the four TLR ligands indicated in Venn. Nodes: proteins. Edges: interactions from STRING database. (C,D) Patterns of gene expression from the microarray data for Il6 (C) and Tnf (D) mRNA. Y-axis (Log2) expression; X-axis showing naïve (N), acute (A), or re-stimulated (R) bone marrow-derived macrophages (BMDM). (E,F) qRT-PCR measurement of Il6 (E) or Tnf (F) mRNA. Y-axis: microarray (Log2) expression. For Box-whisker plots, median, min, max shown, n = 2 or 3 samples * Benjamini and Hochberg adjusted p < 0.05. For histograms, delta–delta CT normalized to normalized to naïve BMDM, n = 3. See also Supplementary Figure 1: TF motif analysis of top 500 DE genes.

