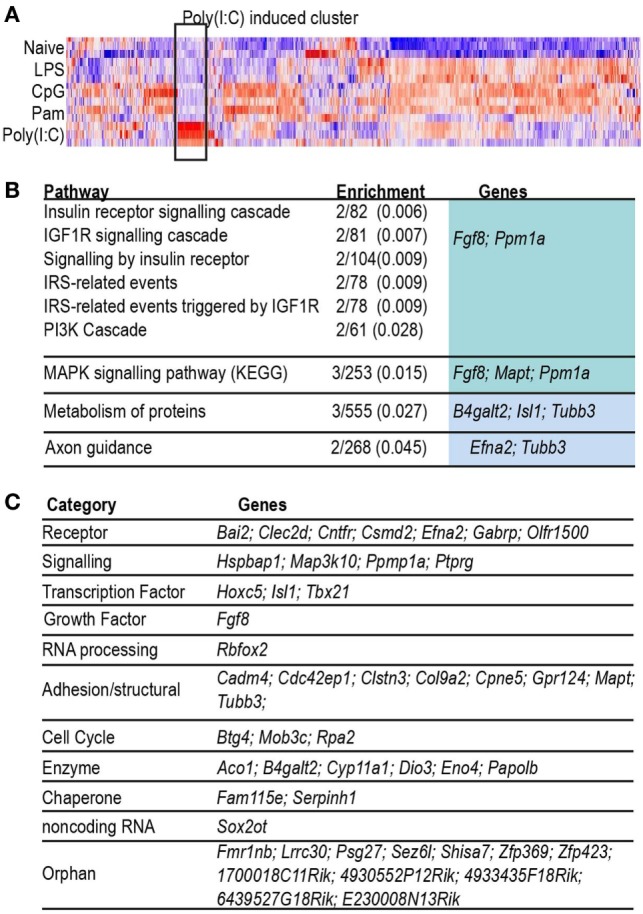
Figure 3.

Characterization of probes induced only by Poly(I:C). (A) Heat map (Pearson correlation) of combined list of top 500 acutely induced genes per acute condition. Color indicates row z-score, ranging from −2 (blue) to 2 (red). Highlight box indicates cluster of probes highly induced only in Poly(I:C). (B) Table of Reactome pathways enriched (adjusted p < 0.05) in genes induced uniquely by acute infection with Poly(I:C). Enrichment: number of genes in test list/number of genes in pathway (adjusted p-value). (C) Table of genes grouped by biological category.
