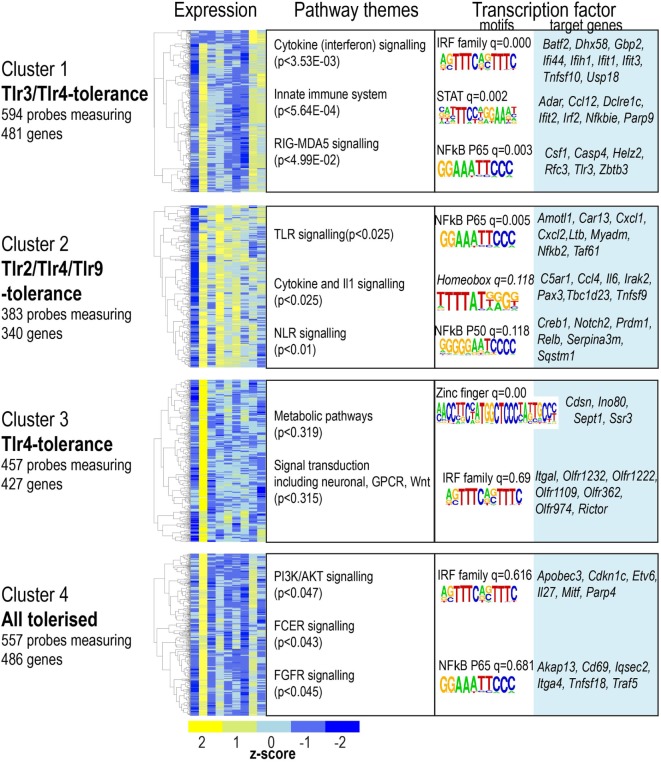
Figure 4.
Four clusters of gene expression reveal toll-like receptor-specific patterns of tolerance. Microarray probes showing tolerance in at least one infection were grouped using partitioning around medoids-clustering. Heat maps for each cluster. Color indicates row z-score of mean log2 expression. Columns (L–R) naïve, lipopolysaccharide acute, and restimulation; CpG acute, restimulation; Pam3csk4 acute, restimulation; Poly(I:C) acute and restimulation. Pearson correlation of z scores shown in rows. Significantly enriched pathways, grouped thematically. Maximum adjusted p-value for all pathways significantly enriched in that theme is shown. Transcription factor binding motifs enriched in each cluster. Motif logos and adjusted q-values are representative for each transcription factor family. Full motif enrichment results are available at www.stemformatics.org.

