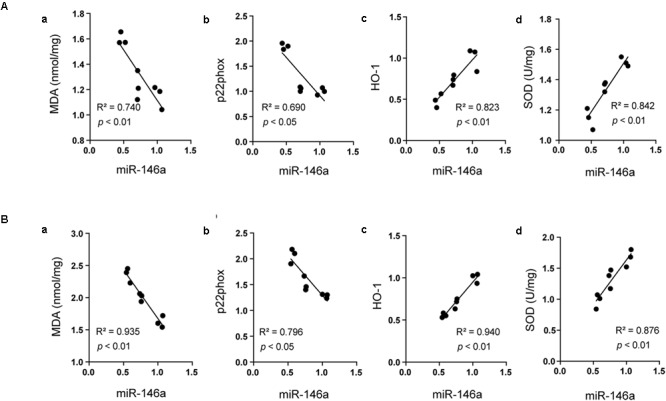
FIGURE 5.

Analysis of the correlation between miR-146a and oxidative status. The correlations between miR-146a level and the expressions of MDA (Aa) (R2 = 0.740, p < 0.01), p22phox (Ab), (R2 = 0.690, p < 0.05), HO-1 (Ac), (R2 = 0.823, p < 0.01), and SOD (Ad), (R2 = 0.842, p < 0.01) in the hippocampus. The correlations between miR-146a level and the expressions of MDA (Ba), (R2 = 0.935, p < 0.01), p22phox (Bb), (R2 = 0.796, p < 0.05), HO-1 (Bc), (R2 = 0.940, p < 0.01), and SOD (Bd), (R2 = 0.876, p < 0.01) in the cerebral cortex.
