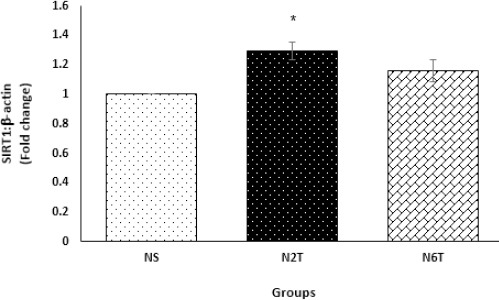
Figure 7.

Hepatic expression levels of SIRT1 mRNA in the study groups. Hepatic level of SIRT1 was significantly elevated in the N2T group compared with the NS group (NS: solvent control, N2T: trans-chalcone for 2 weeks, N6T: trans-chalcone for 6 weeks). Data were expressed as mean±SEM. * P<0.05 versus NS
