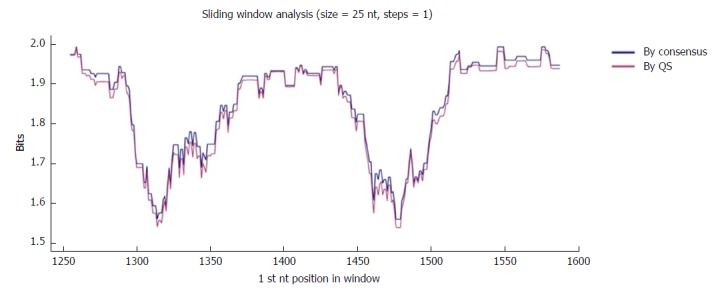
Figure 2.

Sliding window analysis of the nucleotide region of interest in the hepatitis B virus X gene (nt 1255-1611). Each point on the graph is the result of the mean information content (IC, bits) of the windows 25-nt in size, with displacement between them in 1-nt steps. The purple line represents the mean IC from the multiple alignments of all haplotypes (in abundance > 0.25%) in the quasispecies (QS) of all patients (n = 720), whereas the blue line shows the mean IC obtained from the multiple alignments of the consensus obtained for each patient (n = 27).
