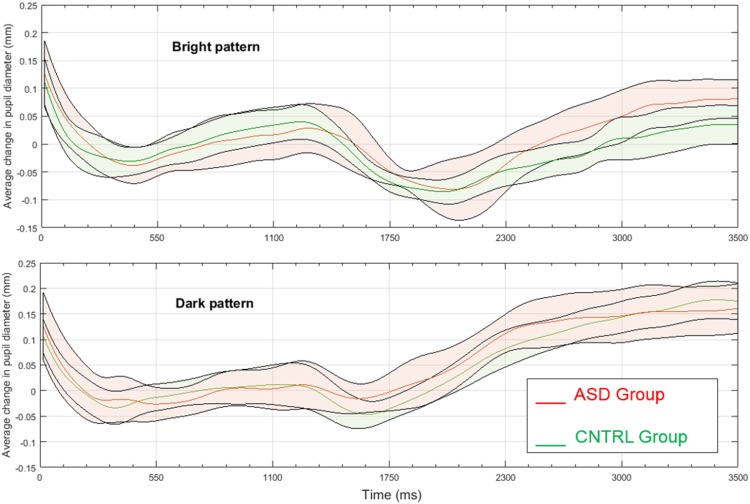
Figure 3.
Mean pupillary change in millimeters to the “bright” pattern (top panel) and the “dark,” control pattern (bottom panel) in the ASD group (red lines and shading) and the Control group (green lines and shading). The shaded stripes indicate 95% confidence intervals around the mean. ASD = autism spectrum disorder; CNTRL = Control.

