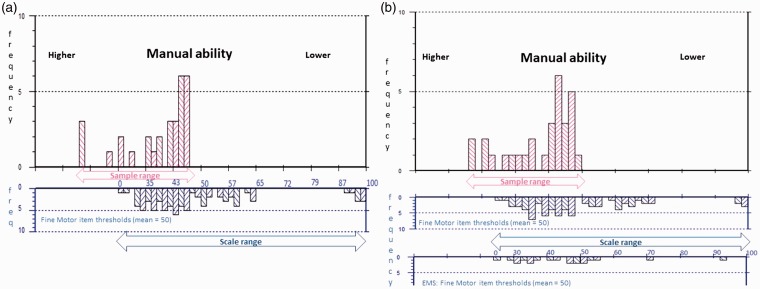
Figure 3.
Fine motor sample to scale targeting.
The upper histograms represent the sample distribution, and the lower histograms the scale item threshold distribution plotted on the same interval metric continuum of manual ability. (a) Displays sample-to-scale targeting of the original Fine Motor 39 items and (b) the improvements to the match between sample and scale targeting introduced by merging the original with the Early Multiple Sclerosis (EMS): Fine Motor items. Sample measurements falling off the 0–100 range of the scale indicate patients for whom the scale remains too easy.

