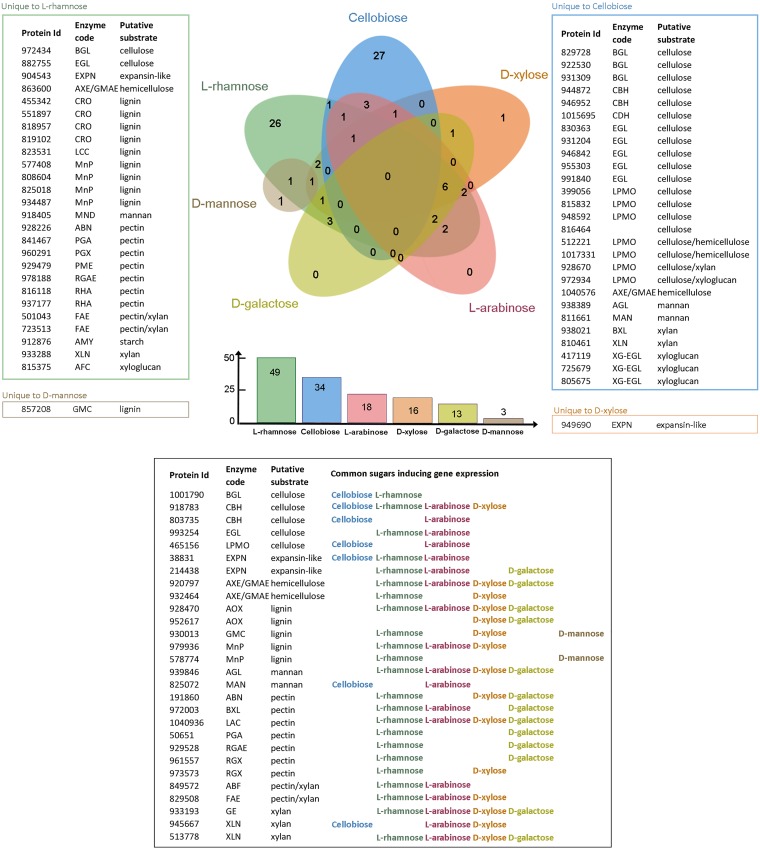
FIG 2.
Comparison of the number of the plant cell wall-degrading CAZyme genes induced by the tested sugars in D. squalens FBCC312. The total number of induced CAZyme genes by each sugar is listed in the bar graph below the Venn diagram. CAZyme genes considered to be induced had a fold change value of ≥2.5 compared to d-glucose, a P value of ≤0.01, and an FPKM value of >10. See Fig. S1 for an explanation of the enzyme codes.

