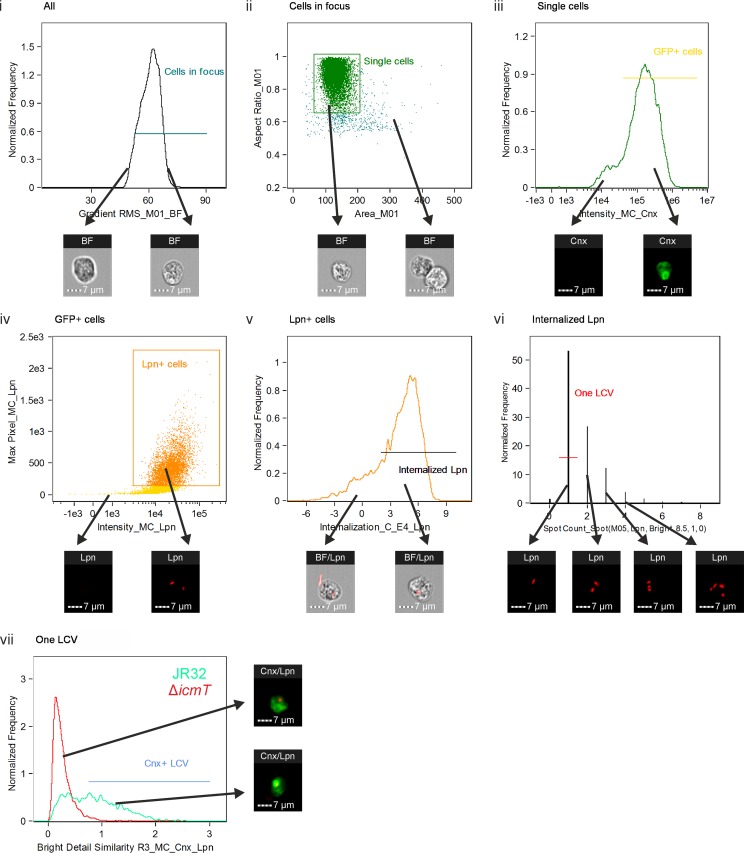
FIG 1.
Imaging flow cytometry-based quantification of calnexin-GFP on LCVs in intact amoebae. D. discoideum Ax3 producing calnexin-GFP (pAW16) was infected (MOI, 5) for up to 2 h with mPlum-producing virulent L. pneumophila JR32 or ΔicmT(pAW14). After fixation, 10,000 cells were acquired with an imaging flow cytometer. The analysis was performed in 7 steps, where the cells gated in one step were carried on to the subsequent step. Examples of included and excluded cells are shown for each step (arrows). (i) Cells in focus were gated using the feature Gradient RMS_M01_BF. (ii) Single cells were gated using Area_M01 versus Aspect Ratio_M01. (iii) Cells producing calnexin-GFP (Cnx) were gated using the feature Intensity_MC_Cnx. (iv) Cells positive for L. pneumophila (Lpn) were gated using Intensity_MC_Lpn versus Max Pixel_MC_Lpn. (v) Cells having internalized L. pneumophila rather than L. pneumophila merely attached to the surface were gated using Internalization_C_E4_Lpn. (vi) Cells containing exactly one bacterium were selected using Spot Count_Spot(M05, Lpn, Bright, 8.5, 1, 0). (vii) The included cells were finally analyzed for colocalization between an L. pneumophila bacterium and calnexin-GFP using the feature Bright Detail Similarity R3_MC_Cnx_Lpn, and the result was termed the IFC colocalization score. A gate was set at 0.75 to include only cells containing a calnexin-positive LCV. The histogram shows an overlay of JR32-infected (green) and ΔicmT mutant-infected (red) cells at 2 h postinfection.

