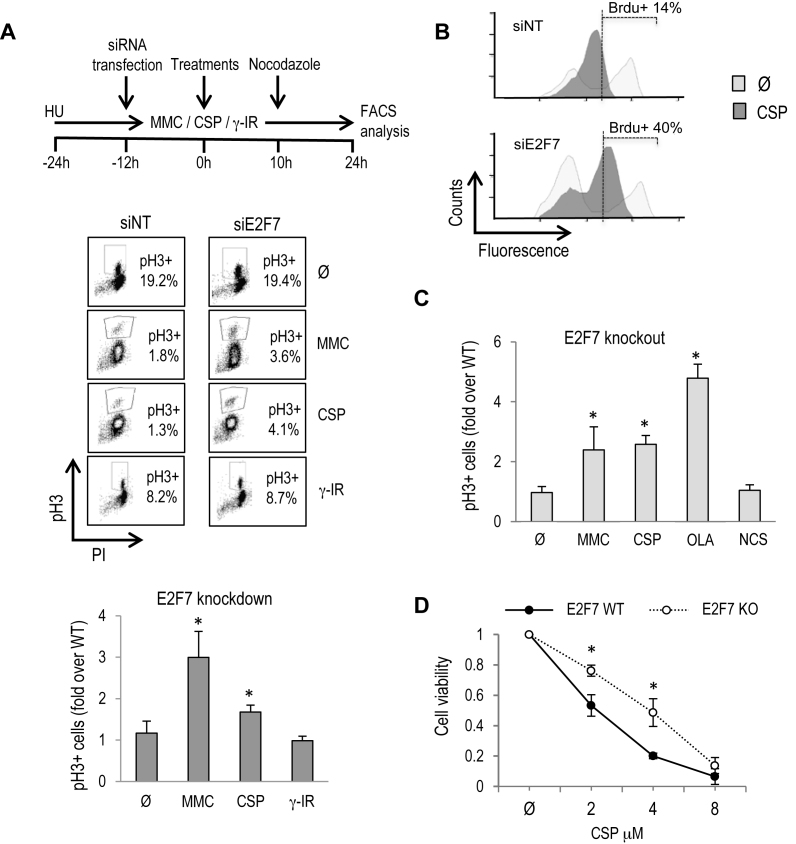
Figure 3.
E2F7 controls cellular recovery after DNA lesions that interfere with fork progression. (A) As shown in the schematic diagram, U2OS cells were HU-synchronized and transfected with siNT and siE2F7. Subsequently, cells were released into the cell cycle and treated for 24 h with 250 nM MMC, 8 μM CSP and a dose of 2.5 Gy of γ-IR. Nocodazole was present in the culture for the last 14 h of culture. The percentage of mitotic pH3-positive cells is shown in a representative figure obtained by FACS analysis. The graphs represent fold-change over siNT values (mean ± SD) of E2F7-depleted pH3-positive cells from four independent experiments. (B) Asynchronously growing U2OS cells were transfected with siNT and siE2F7 and subsequently treated with 8 μM CSP for 12 h. BrdU was present in the cultures for the last 2 h. Cells were stained with anti-BrdU conjugated with FITC and with propidium iodide. A representative FACS analysis is shown. (C) E2F7 knockout and wild-type cells were treated and analyzed as in (A). NCS (20 ng/ml) and OLA (4 μM) were also analyzed in these cells. The graphs represent fold-change of E2F7-knockout pH3-positive cells over parental wild-type values (mean ± SD) from three independent experiments. (D) Clonogenic survival assays were carried out with E2F7-knockout and parental U2OS cells treated with indicated doses of CSP. For each cell line tested, cell viability of untreated cells was defined as 1. Data represent mean ± SD from two independent experiments. Ø, untreated.

