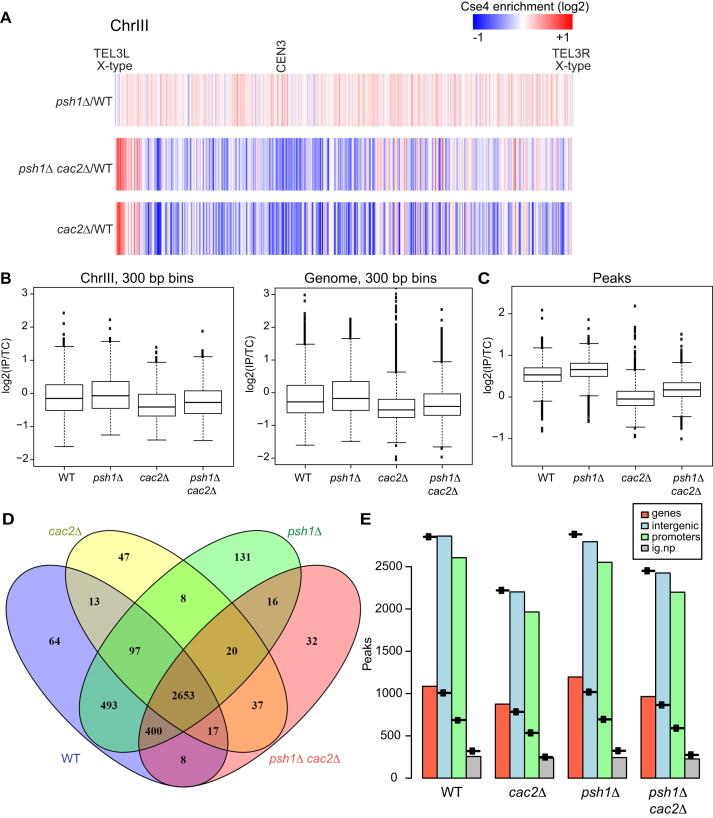
Figure 4.
CAF-1 promotes localization of Cse4 genome-wide. (A) The heat map shows Cse4 patterns of incorporation for chromosome III. Cse4-ChIP-seq ratio tracks were generated using Cse4 levels from psh1Δ, psh1Δ cac2Δ and cac2Δ strains relative to WT. The grid library in R was used to generate heat maps. Red and blue indicates relative enrichment and depletion of Cse4 signal, respectively. The telomeres and the centromere are indicated. Both telomeres on Chromosome III are X-type. (B) The IP:total chromatin ratio for each mutant was divided by the IP:total chromatin ratio for WT for 300 bp bins across chromosome III, and across the entire genome. For chromosome III the P-value for each mutant compared to WT is <0.005 and for the genome, the P-value for each mutant compared to WT is <2.2e-16. (C) The mean IP:total chromatin signal for peaks of Cse4 is plotted for each of the four genotypes indicated, P < 2.2e-16 for each mutant compared to WT. (D) The overlap of the peaks is shown for each genotype. (E) The number of peaks observed is plotted with a symbol indicating the number expected for each genotype. Genic and intergenic regions are in red and blue, respectively, and intergenic regions are further broken down by promoter (green) and non-promoter (gray).

