
Figure 4.
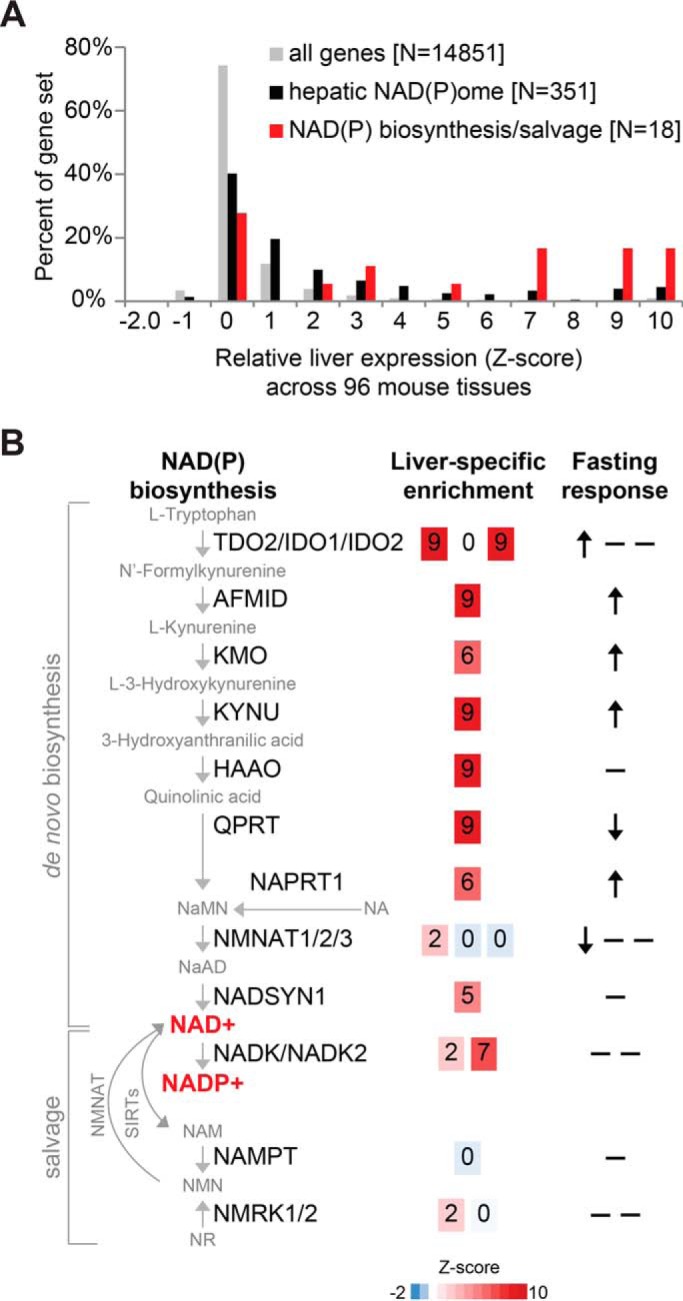
Relative hepatic expression and feeding/fasting changes of the NAD(P) biosynthesis/salvage pathway. A, histogram of liver-specific expression of all genes, hepatic NAD(P)ome genes, and the NAD(P) biosynthesis/salvage pathway based on GNFv3 mouse tissue atlas (71). B, schematic diagram of NAD(P) biosynthesis/salvage genes showing liver-specific expression (Z-score in the GNFv3 mouse tissue atlas (71)) and in fasting versus refeeding (54), where arrows indicate significant changes based on Student's t test, after Bonferroni correction.