Figure 1.
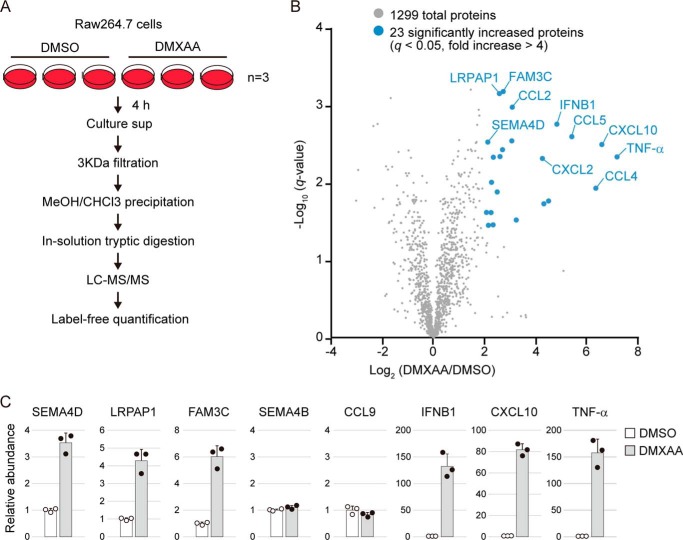
Secretome analysis of DMXAA-treated cells. A, schematic diagram of the label-free quantitative proteomics workflow. Raw264.7 cells were cultured in serum-free DMEM containing DMSO or 100 μg/ml DMXAA for 4 h, and the conditioned medium was collected. The precipitated proteins were digested directly with trypsin/Lys-C. Three biological replicates for each sample were prepared individually and analyzed by LC-MS/MS. Label-free quantification was performed using Proteome Discoverer 2.2 software. B, volcano plot showing differential protein profiles in DMSO- and DMXAA-treated cell culture medium. The x axis indicates log2 -fold change upon DMXAA stimulation. The y axis indicates negative log10 of the t test q value. Proteins increased by more than 4-fold with high significance (q < 0.05) are shown by blue circles. C, an accurate amount of protein in the samples used for proteomics was measured by target LC-MS/MS using the PRM method. The relative abundance was calculated as compared with DMSO control. Scatter plots show the individual data, and bar graphs indicate mean ± S.D. (n = 3).

