Figure 4.
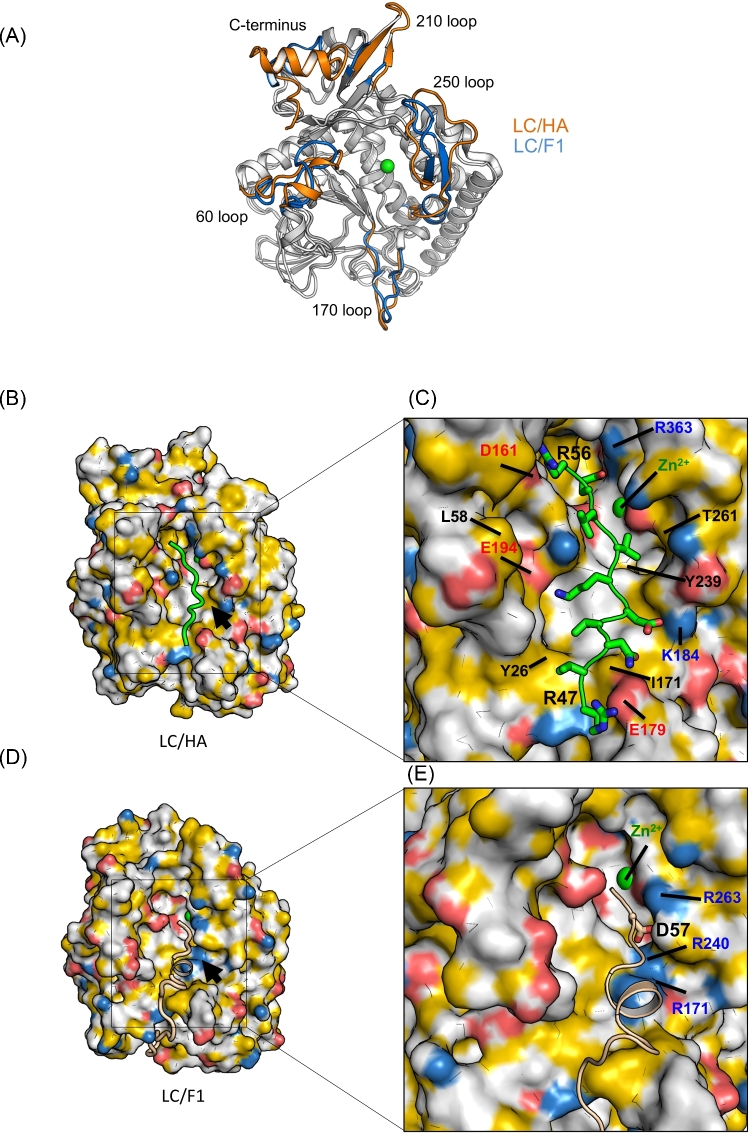
Structural comparison between LC/HA and LC/F1. (A) Structural superposition between LC/HA and LC/F1, and areas that show different conformations are colored in orange for LC/HA and blue for LC/F1. (B) A structure model of the LC/HA-VAMP-2 (R47 – K59) complex. Atoms are colored to highlight hydrophobicity features (Hagemans et al.2015): carbon atoms not bound to oxygen or nitrogen atoms are colored orange, nitrogen atoms carrying positive charges in arginine and lysine are blue, oxygen atoms carrying negative charges in glutamate and aspartate are red, and all remaining atoms are white. A structural model of VAMP-2 is colored green. (C) Close-up view of the LC/HA-VAMP-2 binding surface. Key residues of LC/HA predicted to interact with VAMP-2 are labeled. (D) The structure of LC/F1-VAMP-2 complex (PDB code: 3FIE). The color scheme for LC/F1 is the same as that shown in panel (B), and the VAMP-2 peptide is shown as a wheat cartoon loop. Black arrows mark an electropositive VAMP-2-binding pocket in LC/F1, whereas the corresponding surface in LC/HA displayed different charge property. (E) Close-up view of the LC/F1-VAMP-2 binding surface. Residues that contribute to the unique electropositive surface patch in LC/F1 are labeled.

