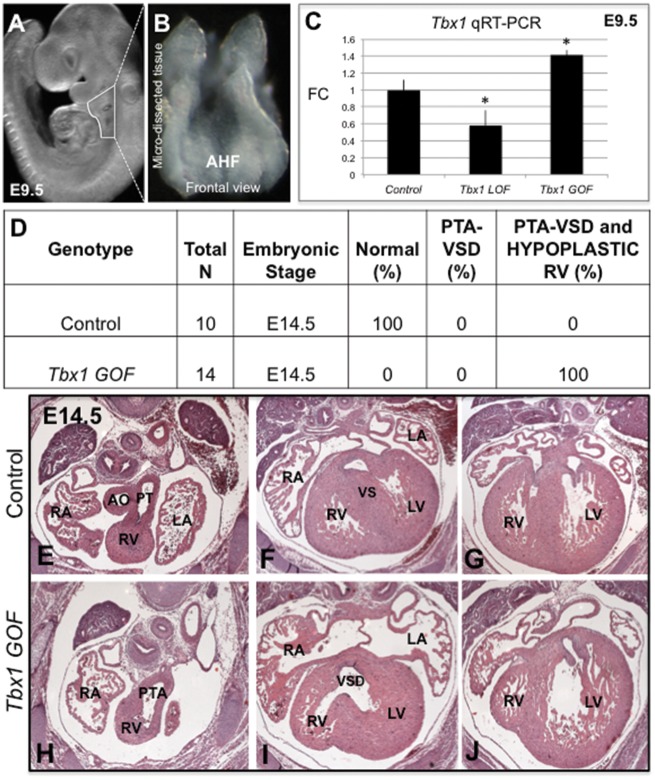
Figure 3.
Characterization of Tbx1 GOF mutant embryos. (A) Whole mount image of a mouse embryo at E9.5 showing the region that has been dissected for quantitative RT-PCR (qRT-PCR) experiments. (B) The micro-dissected region containing the Mef2c-AHF-Cre lineage is shown as a frontal view. (C) Quantification of Tbx1 expression levels in Tbx1 GOF and Tbx1 LOF mutant embryos as well as control embryos at E9.5 by qRT-PCR analysis. Statistical significance of the difference in gene expression was estimated using a two-tailed t-test; FC is fold change, P values <0.05. Error bars are standard deviation (SD). D) PTA phenotype observed in Tbx1 GOF embryos at E14.5. N is total number of hearts observed per group. Hematoxylin and eosin (H&E) stained histological sections of the heart of a control embryo at E14.5 with a normal cardiac OFT and ventricular septum (VS) (E–G). A Tbx1 GOF mutant embryo heart showing a PTA and VSD (H, I) as well as a hypoplastic right ventricle [RV] (J). Abbreviations: aorta (Ao), pulmonary trunk (PT), left atrium (LA), right atrium (RA), left ventricle (LV), right ventricle (RV), pharyngeal arch (PA). Control: Tbx1-GFPf/+ and Mef2c-AHF-Cre/+; Tbx1 f/+, Tbx1 GOF: Mef2c-AHF-Cre/+; Tbx1-GFPf/+, Tbx1 LOF: Mef2c-AHF-Cre/+; Tbx1 f/f.

