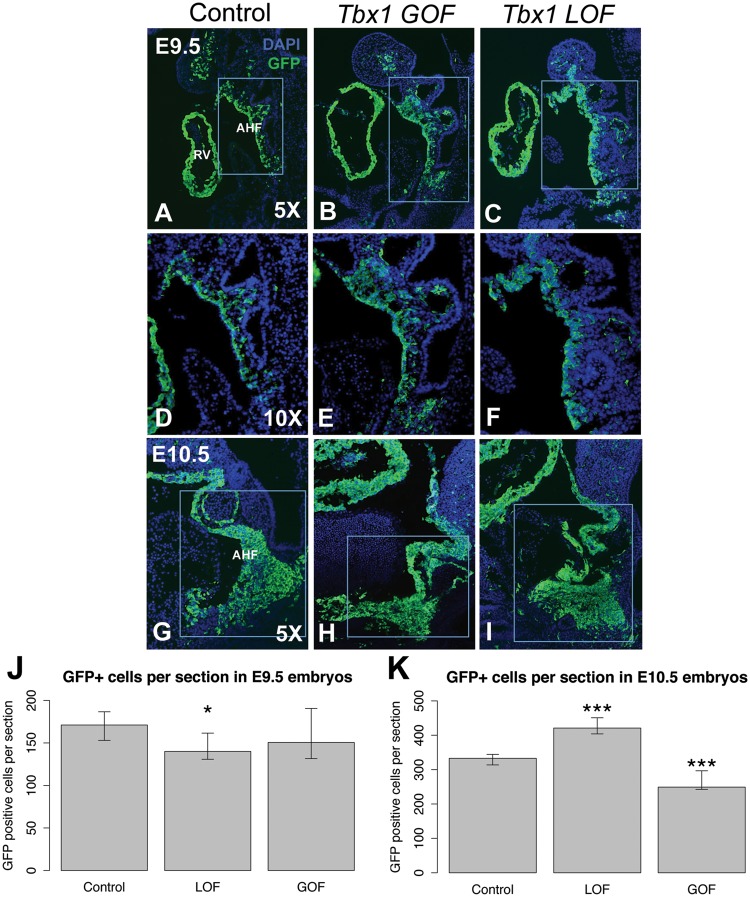
Figure 4.
Changing the Tbx1 dosage in both directions has opposite affects on the Mef2c-AHF-Cre lineage. Representative sagittal sections showing the Mef2c-AHF-Cre lineage using a GFP reporter allele as well as DAPI fluorescent stain to visualize nuclei and identify the tissue is shown in blue. (A) E9.5 control, (B) Tbx1 GOF and (C) Tbx1 LOF embryo sections. (D–F) Higher magnification images of the rectangular areas shown in A, B and C, respectively. (G) E10.5 control, (H) Tbx1 GOF and (I) Tbx1 LOF embryo sections. Quantification of the Mef2c-AHF-Cre lineage from the area shown in the inset for each type of embryo at E9.5 (J) and E10.5 (K). Only one type of control is shown. Control for Tbx1 GOF: Mef2c-AHF-Cre/+; Rosa26GFP/+, Tbx1 GOF: Mef2c-AHF-Cre/+; Tbx1-GFPf/+, control for Tbx1 LOF: Mef2c-AHF-Cre/+; Tbx1 f/+; Rosa26GFP/+, Tbx1 LOF: Mef2c-AHF-Cre/+; Tbx1 f/f; Rosa26GFP/+. Asterisks indicate P value <0.05.

