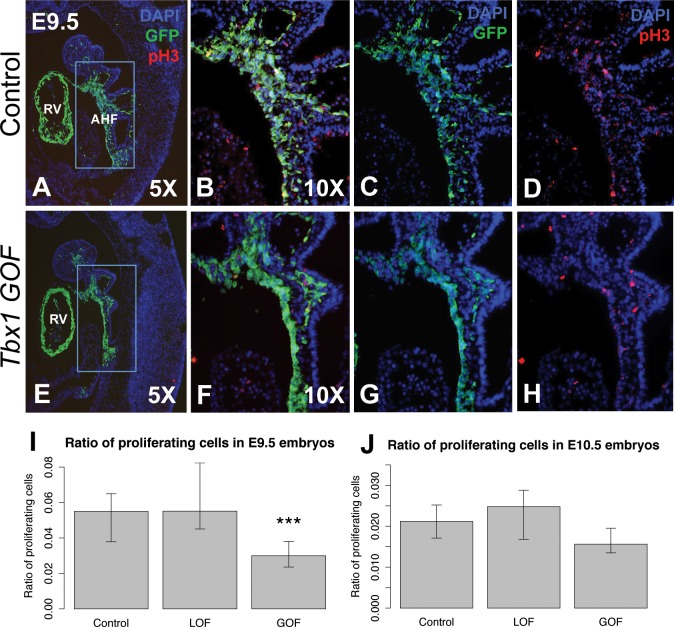
Figure 5.
Proliferation of AHF. (A–J) Proliferation of AHF in controls, Tbx1 GOF and Tbx1 LOF embryos. Immunofluorescence images of sagittal sections to visualize the AHF lineage (GFP, green) and cell proliferation [anti-phospho Histone H3 (Ser10); red]; in control and Tbx1 GOF embryos are shown. DAPI fluorescent stain to visualize nuclei and identify the tissue is shown in blue. (D–F) Higher resolution images provide a snapshot of how the cells were counted for statistical analysis. Statistical analysis was performed to determine whether cell proliferation was the same or different between groups of embryos by two-tailed t-test, P value <0.05. Error bars = standard deviation (SD). Abbreviations: AHF (anterior heart field), right ventricle (RV). Control for Tbx1 GOF: Mef2c-AHF-Cre/+; Rosa26GFP/+, Tbx1 GOF: Mef2c-AHF-Cre/+; Tbx1-GFPf/+, control for Tbx1 LOF: Mef2c-AHF-Cre/+; Tbx1f/+; Rosa26GFP/+, Tbx1 LOF: Mef2c-AHF-Cre/+; Tbx1 f/f; Rosa26GFP/+. Asterisks indicate P value <0.05.

