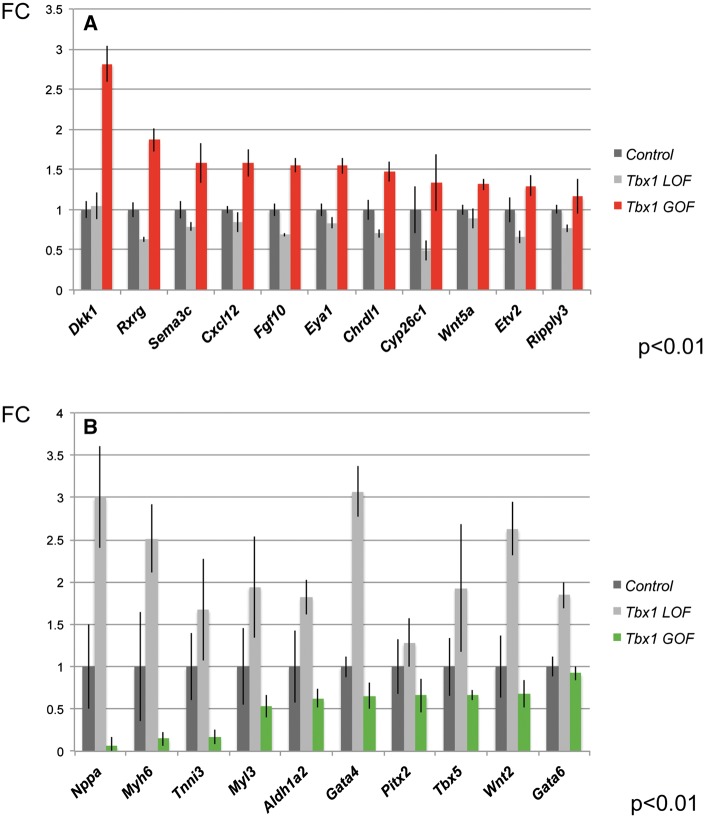
Figure 6.
Gene expression changes in the AHF from Tbx1 GOF versus LOF embryos at E9.5. (A and B) Comparison of representative gene expression changes in the microdissected AHF of Tbx1 GOF and Tbx1 LOF embryos at E9.5. Plotted are differentially expressed genes (P < 0.05 and FC > 1.5) comparing Tbx1 LOF and Tbx1 GOF versus controls by qRT-PCR analysis (FC is fold change).

