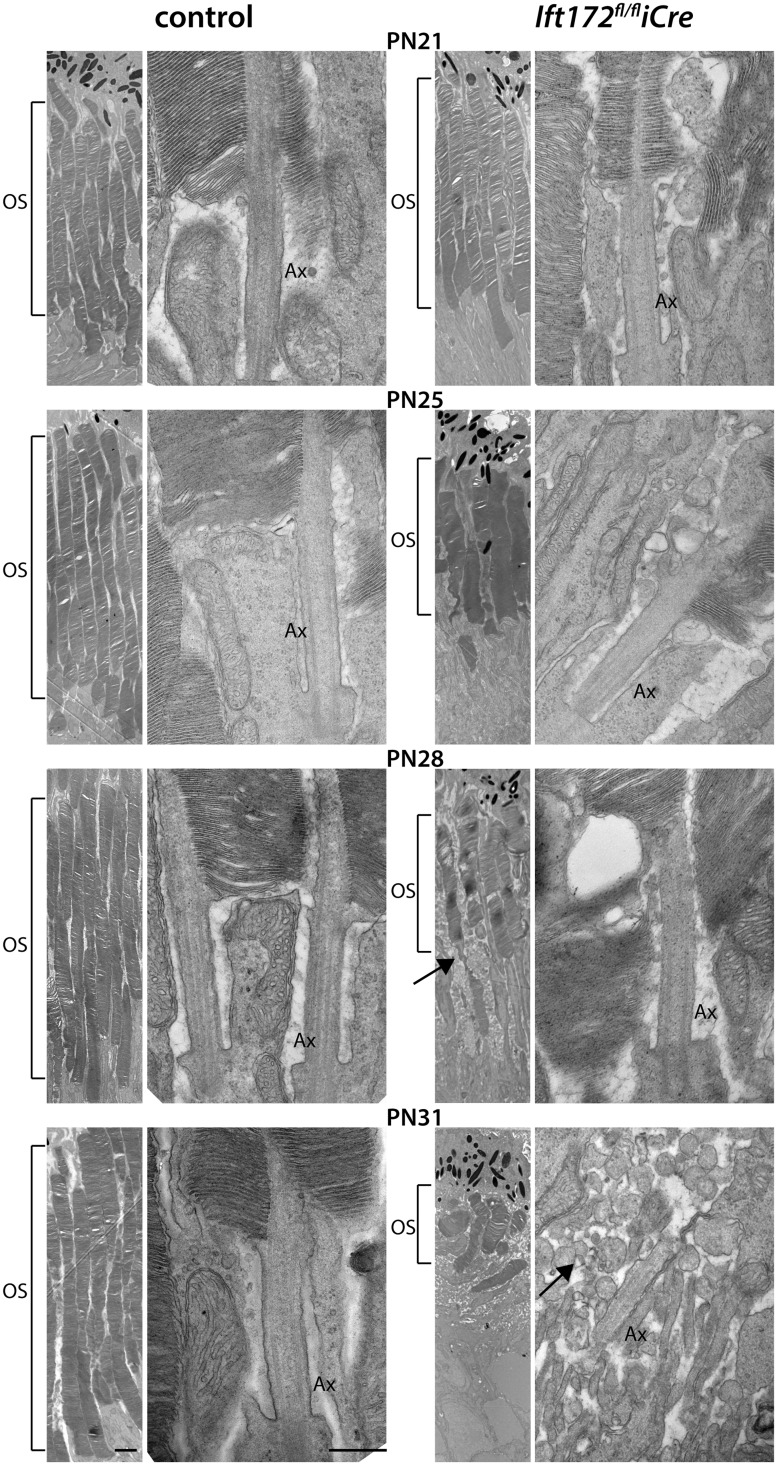
Figure 3.
TEM data ultrastructure of Ift172fl/fliCre and control mice showing OS shortening starting at PN25, marked with square brackets. Membranous cellular debris at PN28 and PN31 is indicated (black arrows). Intact transition zone axonemes (Ax), connecting the ISs and the OS discs are visible up to PN28. At PN31 where severe photoreceptor degeneration with fragmented cell compartments (OS, Ax, membranous cell debris) is visible. Scale bar on the lower magnification picture represents 2μm and on the higher magnification picture at 500 nm.

