Figure 4.
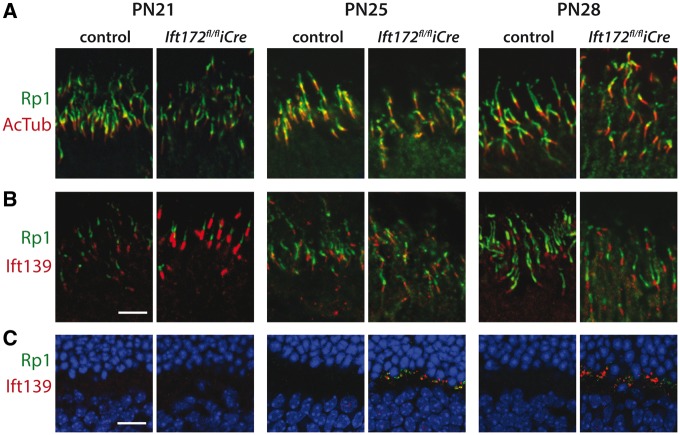
Cilia-associated protein localization. (A) Ciliary axoneme staining with RP1 (green) and AcTub (red) showing shortening of the Rp1 signal relative to AcTub in Ift172fl/fliCre mice compared with controls at PN28 (see also Supplementary Material, Fig. S3). RP1 mislocalization to the IS is visible in Ift172fl/fliCre mice starting at PN25. (B) Staining of IFT139 (red) at the base of the ciliary axoneme, marked with RP1 staining (green). (C) IFT139 (red) and RP1 (green) both mislocalize to the synaptic region in Ift172fl/fliCre mice, but not in controls, starting at PN25. Nuclei in (A), (B) and (C) are counterstained with Hoechst (blue). The scale bars represent 5 μm.

