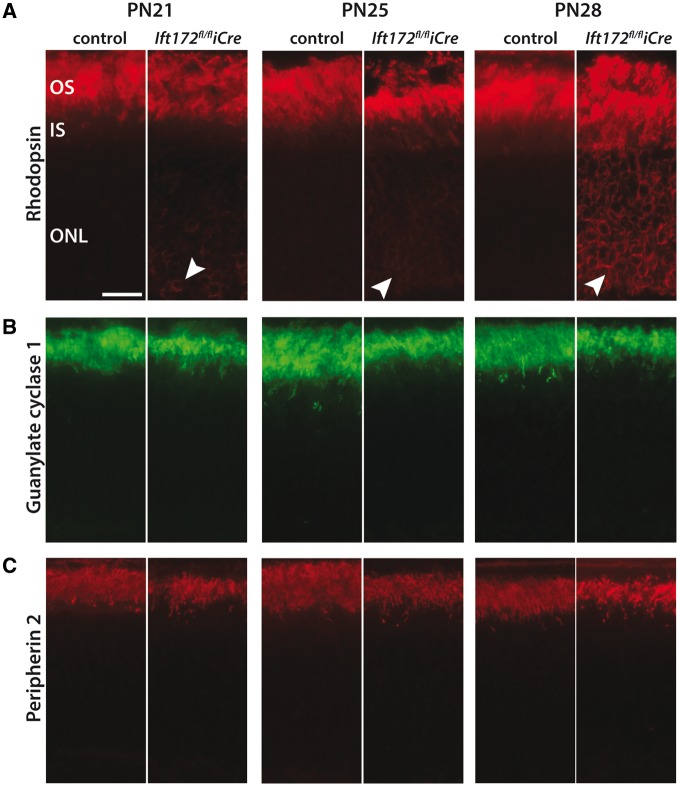
Figure 5.
OS protein localizations. (A) RHO (red) mislocalization to the ONL (white arrowheads) is visible at PN21 and progresses over time in Ift172fl/fliCre mice compared with Ift172fl/fl controls. (B and C). Guanyl cyclase 1 (green) and Peripherin2 (red) localize appropriately to the OS at all tested time points in both Ift172fl/fliCre mice and Ift172fl/fl controls. The scale bar represents 10 μm.

