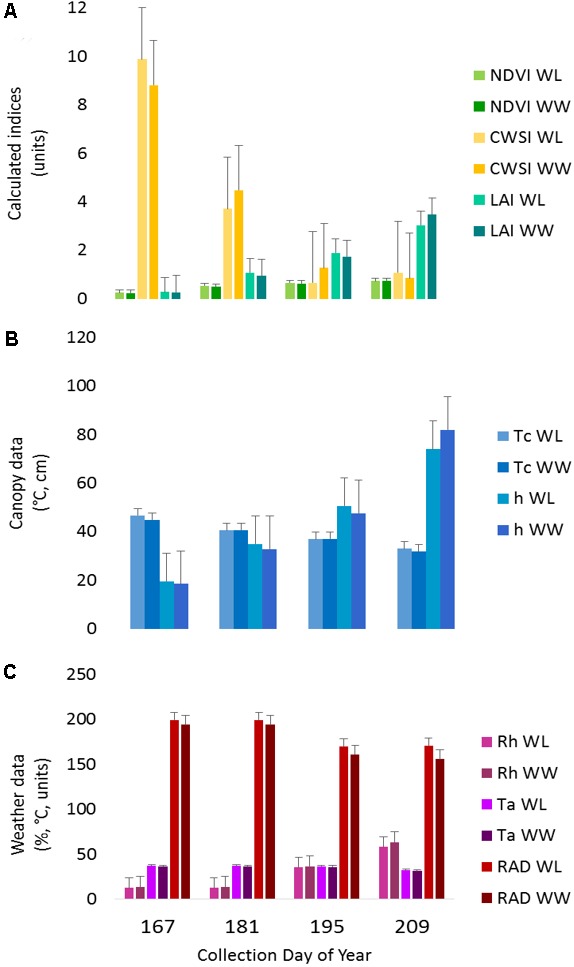
FIGURE 3.

Proximal sensing carts (PSC)-derived phenotypes split out by irrigation treatment for each collection day. The data represent the average of each phenotype for the designated treatment and day of year. (A) The normalized difference vegetative index (NDVI), crop water stress index (CWSI), and leaf area index (LAI) data are presented as calculated index units with corresponding error bars. (B) The canopy temperature (Tc) and canopy height (h) with the corresponding error bars. (C) The weather data presented in each respective unit of measurement for ambient air temperature (Ta), relative humidity (Rh), and radiant energy (RAD) with corresponding error bars.
