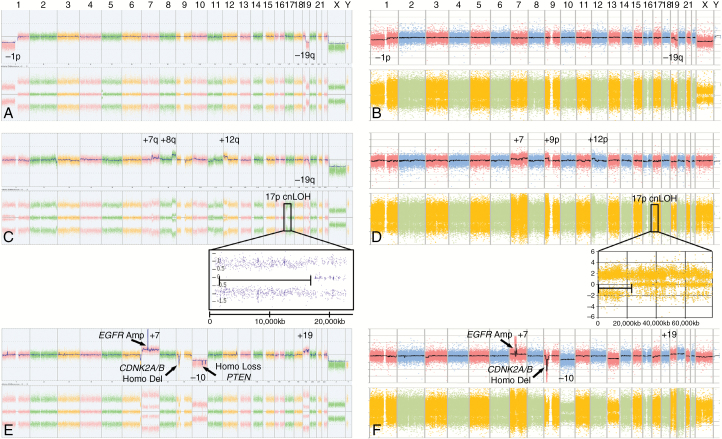
Fig. 1.
Chromosome Analysis Suite (ChAS) Affymetrix OncoScan arrays and first-generation Affymetrix MIP arrays from gliomas in 3 molecular subtypes show comparable characteristic alterations. OncoScan arrays from sporadic gliomas (left) and MIP arrays from familial gliomas (right). Characteristic CNVs are labeled for (A, B) IDH-mutant and 1p/19q codeleted glioma, (C, D) IDH-mutant non-codeleted glioma, and (E, F) IDH-wildtype glioma. The insets for IDH mutant non-codeleted glioma arrays (C, D) illustrate regions of chromosome 17p cnLOH, a characteristic in most IDH-mutant non-codeleted gliomas. Since ChAS 3.1.0.15 software could not be used to view first-generation MIP array data (B, D, F), these data were plotted using Microsoft Excel (see Materials and Methods).

