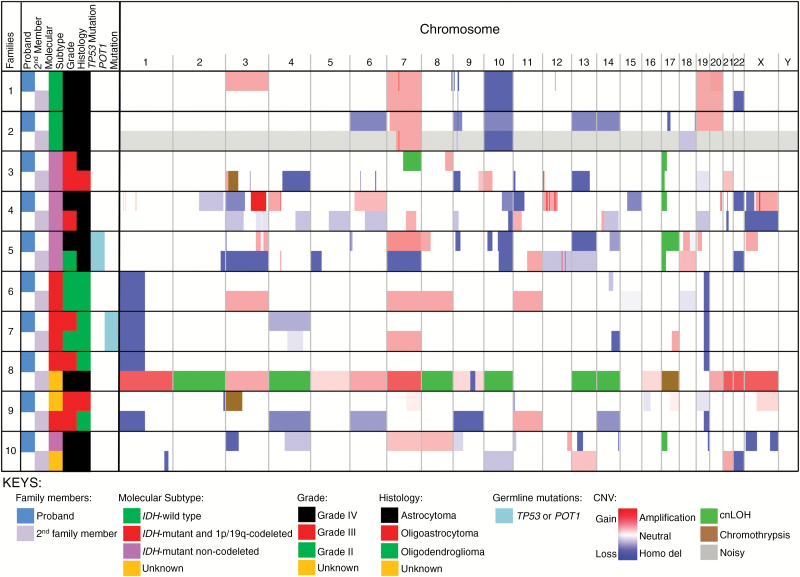
Fig. 3.
Seven of the 10 paired gliomas from families with 2 available tumors show concordance for molecular subtype. Left: family attributes, including designation as proband or second family member, molecular subtype, grade, histology, or the presence or absence of germline mutations (see keys). Right: Integrated Genomic Viewer figure illustrating CNVs (with gray indicating samples that were noisy and/or difficult to interpret). Every 2 horizontal rows represent one family, with the top being the proband and the bottom being the second family member. Intensity of red or blue color corresponds to degree of gain or loss, respectively, of copy number, while green depicts cnLOH, and brown depicts chromothrypsis. Vertical columns represent chromosome number (listed at the top). Size of color bands corresponds to size of chromosome alteration.

