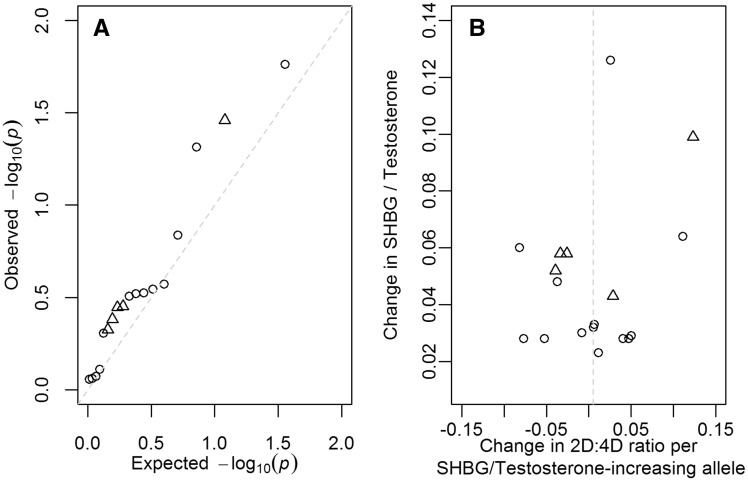
Figure 2.
Plots highlighting the relationship of 13 SHBG and five testosterone associated SNPs (45–48) with the left hand 2D:4D ratio discovery meta-analysis. (A) Q-Q plot of the meta-analysis P-values for each of the SNPs. (B) Plot of the β coefficient for the left hand 2D:4D ratio meta-analysis against the β coefficient previously reported for SHBG or testosterone (the 13 SHBG associated SNPs are aligned to the SHBG increasing allele and the five testosterone associated SNPs are aligned to the testosterone increasing allele). Triangles indicate SNPs associated with testosterone, circles indicate SNPs associated with SHBG.

