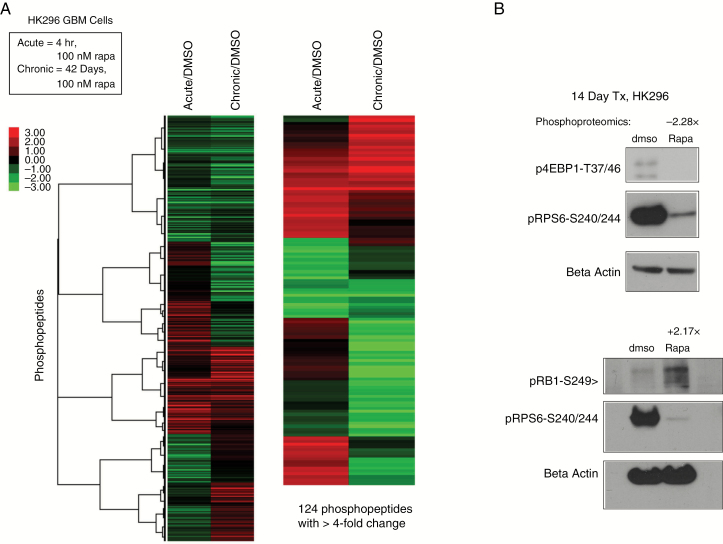
Fig. 1.
Phosphoproteomics of mTOR inhibition. (A) Heatmap of phosphoproteomics results comparing chronic rapamycin treatment or acute rapamycin treatment with DMSO treated controls. The relative levels of phosphopeptides are expressed as log2 of the ratios relative to control (DMSO). The heatmap on the left depicts proteins with ≥2-fold differences and the one on the right shows those with ≥4-fold differences. (B) Western blot of phosphorylated 4EBP1-T37/46 (p4EBP1), phosphorylated RB1-S249 (pRB1), and phosphorylated RPS6-S240/244 (pS6) demonstrating changes after 14 days of chronic rapamycin treatment (14 days, 100 nM). Phosphoproteomics values (−2.28x and +2.17x) above blots indicate the fold changes for p4EBP1-T46 and pRB1-S249, respectively, in phosphorylation levels as detected by the phosphoproteomics screen. See also Supplementary Table S1.

