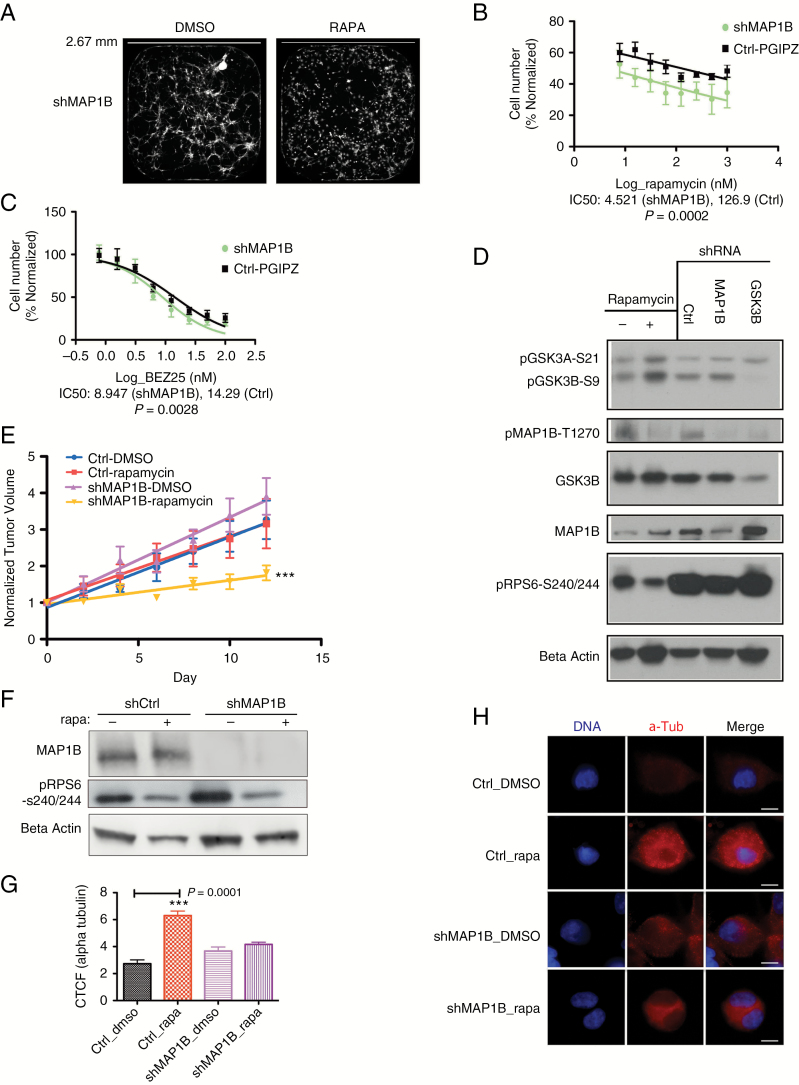
Fig. 4.
Knockdown of MAP1B confers sensitivity to chronic mTOR inhibition. (A) Fluorescent images of wells from 384 well plates used in the targeted shRNA screen display green fluorescent protein–labeled cells in shMAP1B conditions at 10 days posttreatment (DMSO-control or 100 nM rapamycin [RAPA]). White scale bar represents 2.67 mm. (B) Fitted curve of log transformed values for a serial dilution of rapamycin in HK217 GBM cells, with and without MAP1B knockdown, after 6 days of proliferation, P = 0.0002 comparing IC50 values (N = 3). (C) Fitted curve of log transformed values for a serial dilution of BEZ235 in HK217 GBM cells, with and without MAP1B knockdown, after 6 days of proliferation, P = 0.0028 comparing IC50 values (N = 4). (D) Western blot of HK301 cells. Western blot columns are in order: 7 day chronic DMSO-control, 7 day rapamycin, shRNA-control (C), shMAP1B (M), shGSK3B (G). (E) Observed points, standard error bars, and fitted lines for normalized tumor volumes of HK374 subcutaneous tumors at different time intervals. By day 12 posttreatment, the shMAP1B under rapamycin treatment demonstrates increased sensitivity and reduced tumor growth, as indicated by a comparison of the slopes (P < 0.0001) as well as by comparison of the means (P = 0.0323, Kruskal‒Wallis test). (F) Western blot of the tumor lysates demonstrates that the shMAP1B transplanted tumors maintained depletion of MAP1B throughout the tumor growth. Phosphorylated RPS6 levels demonstrate that rapamycin inhibited its target pathway in the tumors. (G) Bar graph shows mean ± SEM for the corrected total cell fluorescence (CTCF) of alpha-tubulin in HK217 GBM cells after 7 days of chronic rapamycin treatment followed by acute exposure to 5 μM Nocodazole (30 min). There is a significant increase in the rapamycin conditions compared with the DMSO conditions for the pGIPZ-Ctrl vector (P = 0.001; Mann‒Whitney test). There is no significant difference between the DMSO and rapamycin conditions for the shMAP1B infected cells (P = 0.1431). Each condition represents the corrected total cell fluorescence of 10 individual cells. (H) Representative photographs of alpha tubulin staining of HK217 GBM cells in the different 7 day treatment conditions and after acute Nocodazole treatment. White scale bar indicates 10 μM. See also Supplementary Table S2, and Supplementary Figures S4, S5.

