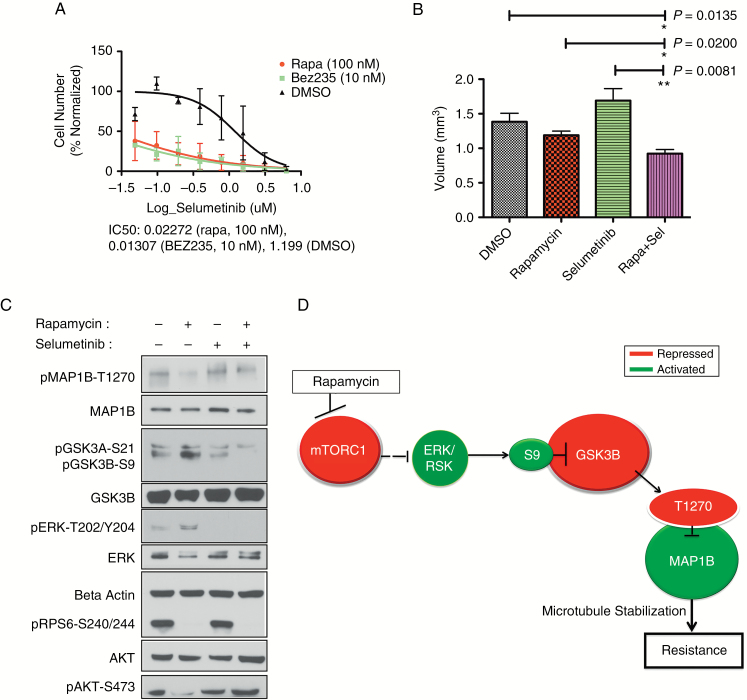
Fig. 5.
In vivo support for our model of regulation of resistance to mTOR inhibition. (A) Representative sample of sensitization effect on HK374. Log scale of relative cell numbers following treatment with a serial dilution of doses of selumetinib (μM) in the presence of DMSO (black line), 100 nM rapamycin (red line), or 10 nM BEZ235 (green line). The calculated IC50 values are displayed for each combinatorial treatment (selumetinib + second inhibitor listed). (B) Quantification of tumor value at day 9 is depicted. Treatment groups (mean ± SEM) are compared with the DMSO treated control. P-values for the Mann‒Whitney statistical comparison test are indicated for each comparison. ANOVA comparing all groups had P = 0.0010. (C) Western blot of pooled xenograft tumors (6 animals/treatment group, 12 tumors/treatment group) depicts effective targeting of rapamycin and selumetinib after 9 days of treatment as well as phosphorylation status of MAP1B and GSK3B. (D) Schematic of proposed model of resistance to chronic mTOR inhibition. Dotted line represents indirect association. Red color indicates inactivation under chronic treatment, green color indicates activation. See also Supplementary Figure S6.

