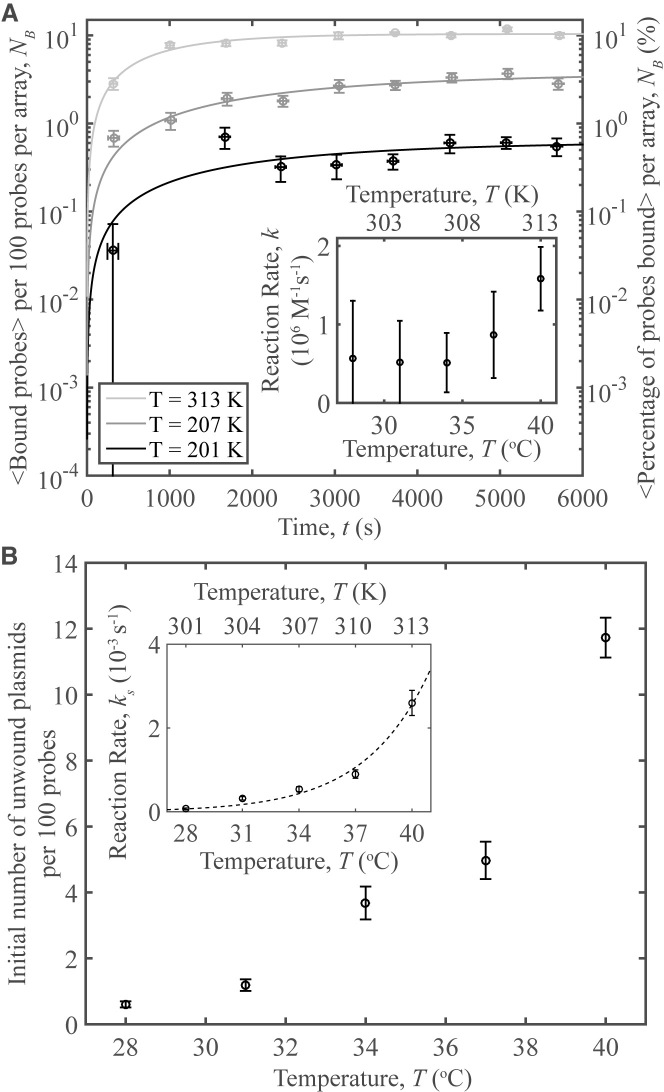
Figure 5.
probe–plasmid binding and temperature. (A) The number of binding events per 100 probes averaged over 10 different videos vs. time, for three temperatures studied. Curves represent fits to the data. The plasmids have a superhelical density of <σ> = −0.108, sσ = 0.07. Inset: Reaction rates vs. temperature obtained from the data fits. (B) The number of unwound plasmids obtained from the fits in a) per 100 probes vs. temperature. Inset: the short-time reaction rate, ks, versus temperature for the data in part A. The reaction rates are fit to an exponential demonstrating Arrhenius behavior. Each data point was averaged over ∼3300 probes, indicating high-throughput. Error bars in (A) and the inset of (B) denote the standard error of the mean of the binding for the 10 averaged videos on the y-axis, while those on the x-axis represent the standard error of the mean of the time. Error bars on the fit parameters represent the 95% confidence interval of the fit.

