Figure 4.
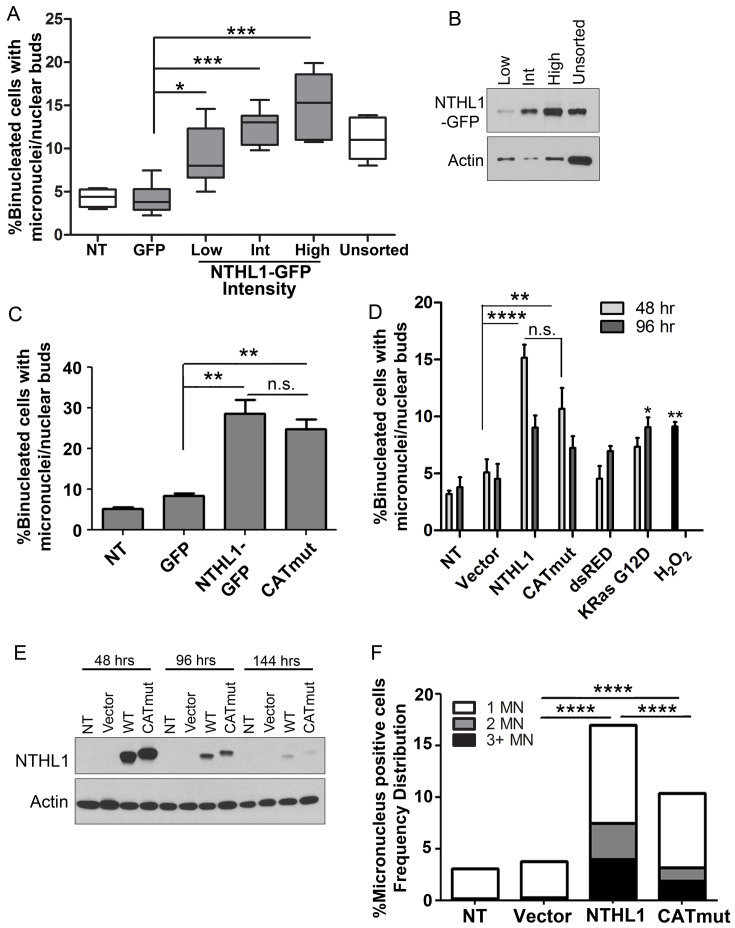
Genomic instability is induced by wildtype NTHL1 and CATmut overexpression. (A) HBEC cells expressing NTHL1-GFP were FACS sorted based on GFP signal intensity. GFP positive cells were further sorted into three populations based on the intensity of the GFP signal into low, intermediate (Int), and high groups, and micronucleus formation was measured in each population and compared to unsorted NTHL1-GFP cells. Non-transfected (NT) cells and cells expressing GFP alone (GFP), were used as controls. Data from NT, GFP alone, and ‘unsorted’ cells were collected from unsorted cell populations. (B) Immunoblot of NTHL1 from the FACS sorted cell population of low, Int and high GFP intensity signals. (C) U2OS cells transiently overexpressing either NTHL1-GFP or CATmut-Flag were analyzed for micronucleus formation. Like HBEC cells, U2OS cells show an increase in micronucleus formation. (D) Overexpression of NTHL1 or CATmut in HBEC cells causes micronuclei induction at 48 hours following transfection compared to empty vector (Vector) control cells. Expression of red fluorescent protein (dsRED) or of G12D mutant K-Ras and treatment with hydrogen peroxide (H2O2) were all used as controls for micronucleus formation. KRas G12D produced statistically significant micronucleus induction at 96 hours compared to empty vector control. Micronuclei formation in dsRED-expressing cells is not significantly different from vector control at 48 or 96 h. (E) Immunoblots for NTHL1 and CATmut at 48-, 96- and 144-h time points following transient overexpression in HBEC cells show that NTHL1 and CATmut expression is decreased at 96 hours. NTHL1 expression decreases further 144 hours following transfection. (F) The number of micronuclei (MN) per binucleated cell increases in NTHL1 or CATmut overexpressing HBEC cells. Cells were scored as having 1, 2 or 3 or more micronuclei (MN) per binucleated cell. NS = non-statistically significant; *P≤ 0.05; **P≤ 0.01; ***P≤ 0.001; ****P≤ 0.0001.

