Figure 6.
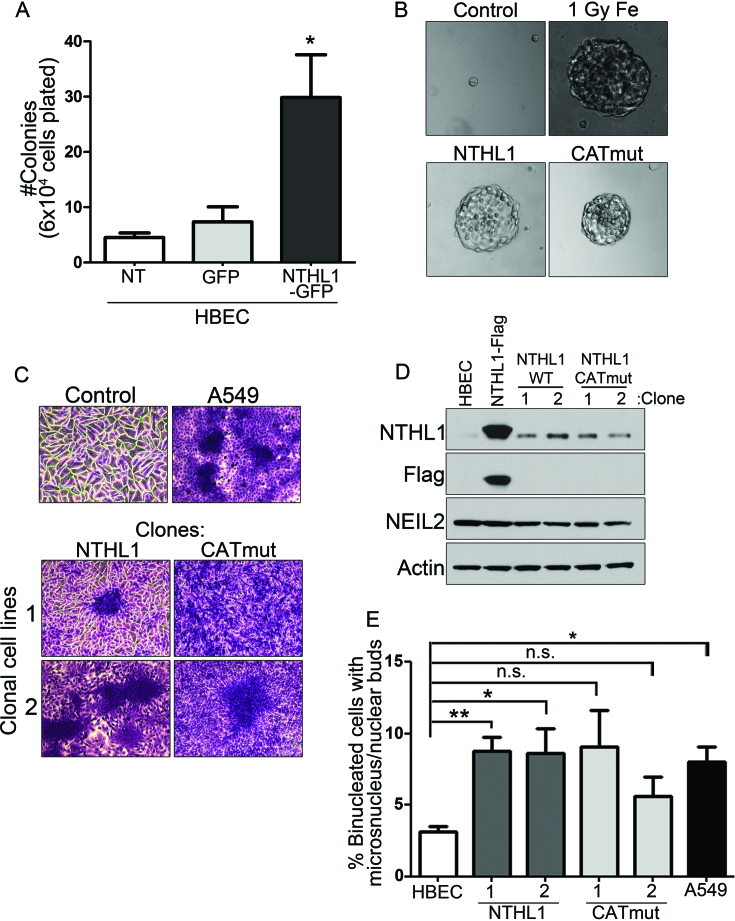
Cellular hallmarks of cancer are conferred by wildtype NTHL1 or CATmut overexpression. (A) HBEC cells were FACS sorted for NTHL1-GFP expression. Cells were assayed for colony formation in soft agar. (B) HBEC cells overexpressing NTHL1-Flag or CATmut-Flag were grown in soft agar. Parental HBEC cells (control) did not form soft agar colonies, while HBEC cells transformed with 1 Gy of Iron ion irradiation (1 Gy Fe) did. (C) Cell lines derived from HBEC soft agar colonies transformed by NTHL1 or CATmut overexpression were crystal violet stained to display loss of contact inhibition, in contrast to the (control) monolayer growth of HBEC parental cells and comparable to the A549 NSCLC line. Two independent cell lines were created from soft agar colonies for NTHL1 and CATmut. (D) Immunoblot of NTHL1 in each of the isolated clonal cell lines. NTHL1-Flag overexpression in lane two is a transient overexpression that serves as a control. Another BER glycosylase, NEIL2, shows no change in any of the samples analyzed. The Flag epitope is not detected in cells clonally derived from soft agar. (E) Clonal cell lines derived from soft agar demonstrate persistent genomic instability measured by the micronucleus assay compared to non-transfected (NT) HBEC cells and the A549 line as a positive control. NS = non-statistically significant; *P≤ 0.05; **P≤ 0.01; ***P≤ 0.001; ****P≤ 0.0001.

