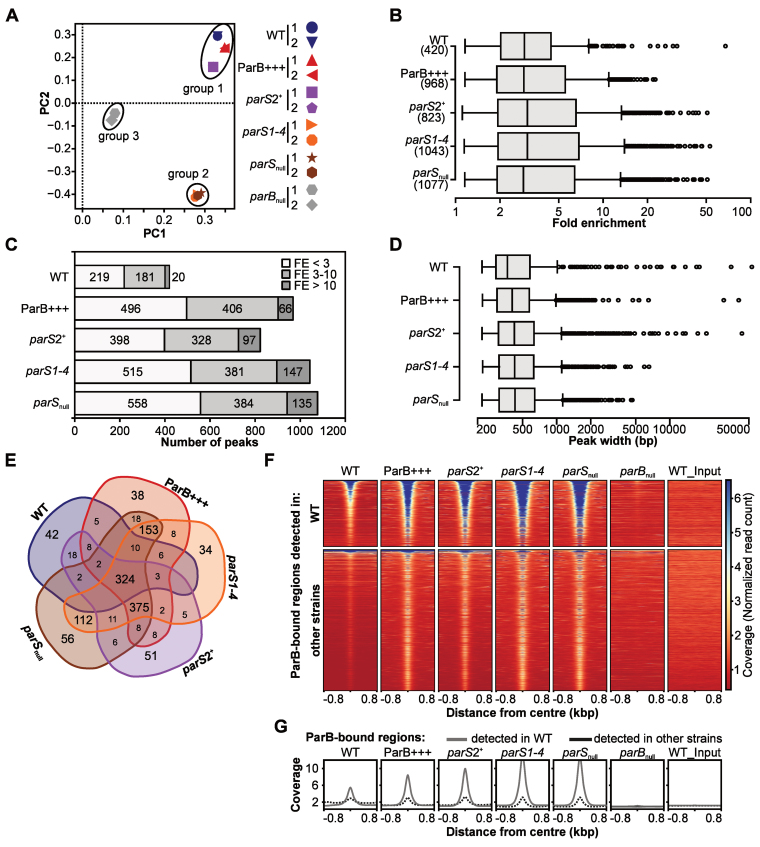
Figure 2.
ChIP-seq analysis of ParB interactions with Pseudomonas aeruginosa chromosome. Reads obtained by ChIP-seq for two biological replicates were mapped to the PAO1 genome using Bowtie2 to generate BAM files, subsequently used in peak calling with MACS2. (A) PCA of BAM files. The identified components represent directions along which the variation in the data (read coverage values) is highest, allowing analysis of variability between the strains and biological replicates of the same strain. (B) Distribution of FE values for detected peaks. (C) Number of ParB ChIP-seq peaks categorized according to their FE. (D) Distribution of width of ParB ChIP-seq peaks. (E) Compilation of ParB-bound regions in five strains. Two peaks in two strains were considered identical if their summits were <200 bp apart. The analysis yielded 1305 unique regions (Supplementary Table S7). (F) Coverage heatmap around centers of ParB-bound regions. The analysis was performed separately for 420 ParB-associated regions detected in WT strain (top) and 885 regions only detected in at least one of the remaining four strains (bottom). Normalized read counts for each nucleotide were averaged for two biological replicates of each strain and colored according to scale. Each line in the heatmap represents ±800 bp around the center of the region. Rows were sorted in descending order of mean coverage value. The same regions analyzed in parBnull and WT input are included as controls. (G) Mean coverage for two groups of analyzed regions (as in F) in different strains.

