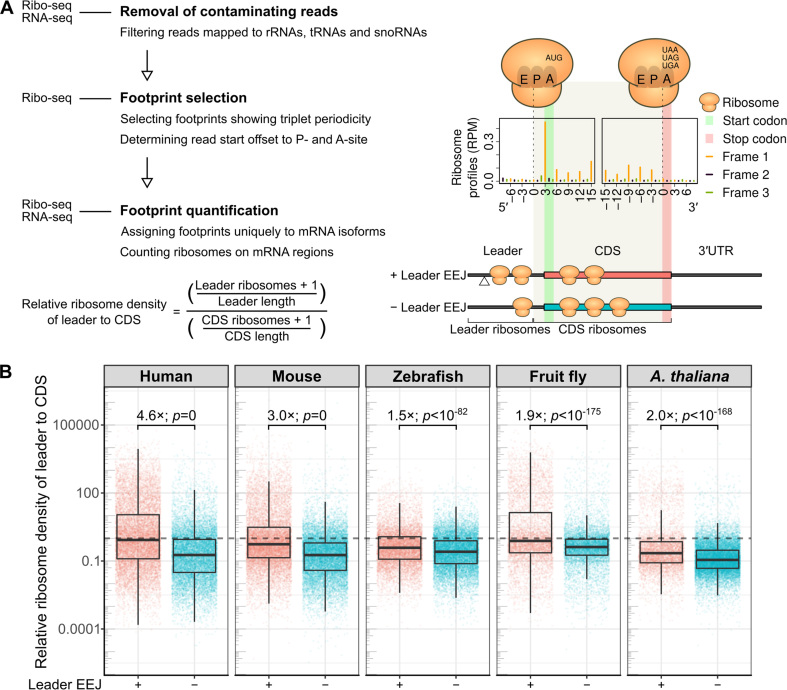
Figure 2.
Distributions of translating ribosomes on the mRNAs. (A) Schematic representation of Ribo-seq data analysis (left panel, Materials and Methods). The publicly available datasets analyzed are of HeLa cells, mouse liver, zebrafish 48 h embryos, fruitfly 0–2 h embryos, and A. thaliana seedlings (Supplementary Table S1). The read start positions of ribosome footprints were adjusted to ribosomal A-site, as shown in the metagene ribosome profiles of mouse mORFs (right panel). To avoid misassignment, ribosome footprints mapped to three bases upstream of the start codon (gray shading) were counted as CDS ribosomes (Supplementary Table S2). (B) Relative ribosome density of the mRNA leader to CDS (see equation in A). Fold difference of the median and the P-value from t-test are shown. The dotted line marks the ratio of one, when the density ratio of an mRNA is equal. CDS, coding sequence of the mORF; EEJ, exon-exon junction; mORF, main open reading frame; RPM, Reads Per Million mapped reads.

