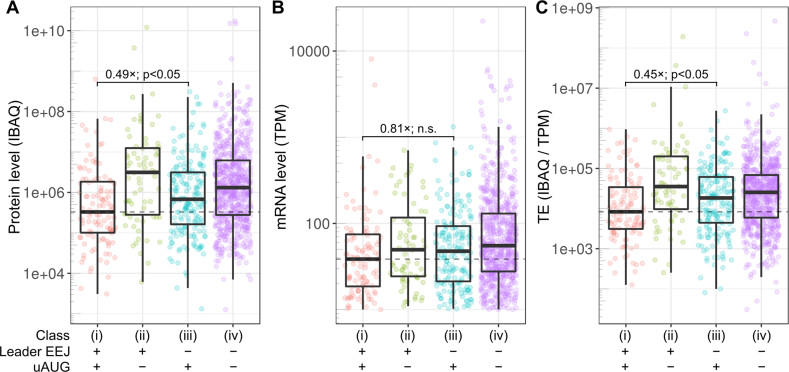
Figure 5.
Protein expression of HepG2 cells. (A) Protein, (B) mRNA and (C) TE levels were quantified at the gene level. Classes are as in Figure 4. EEJ, exon-exon junction; IBAQ, Intensity-Based Absolute Quantification; n.s., not significant (P-value > 0.05); TE, translation efficiency (ratio of protein to mRNA); TPM, Transcripts Per kilobase Million mapped reads; uAUG, upstream AUG. The processed data is available in Supplementary Table S5. Also see the related Supplementary Figure S9.

