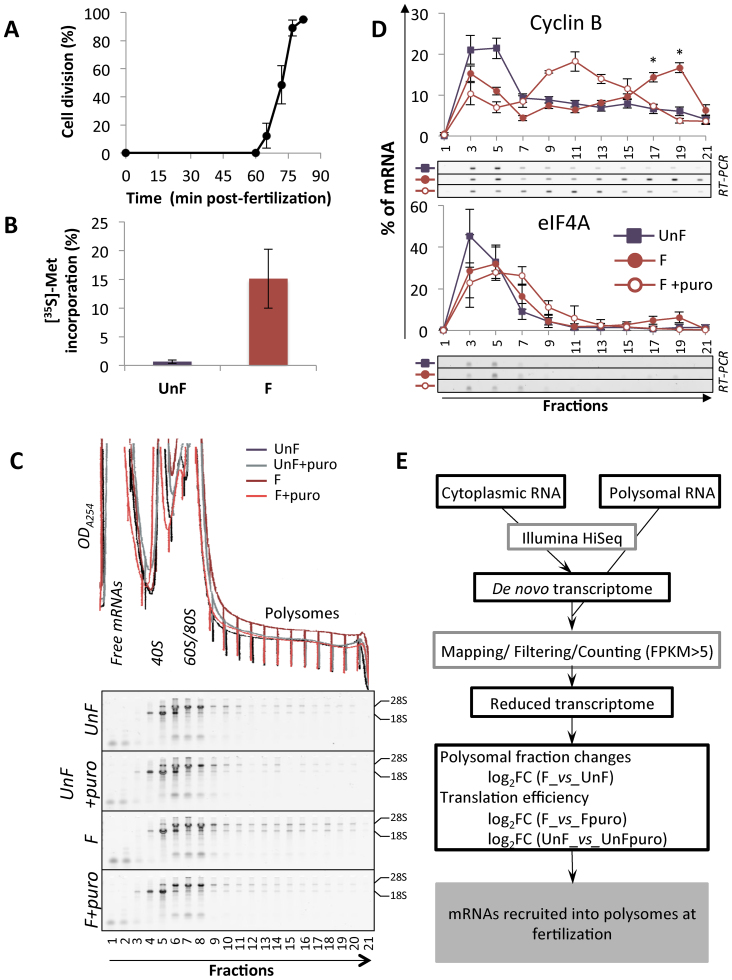
Figure 1.
(A) Cell division kinetics in Paracentrotus lividus from two independent experiments, error bars represent standard deviation. (B) Protein synthesis activity measured by 15-min pulse-labeling in unfertilized eggs (UnF) and in fertilized embryos (F) performed at 1 h post-fertilization. The results are expressed as the percentage incorporation of [35S]-methionine into protein over total radioactivity taken up by the cells in three independent experiments. Error bars represent standard deviation. (C) Optical density profiles (ODA254) of polysome gradient profiles (top) and corresponding RNA profiles are shown for unfertilized eggs and fertilized embryos treated with puromycin or left untreated. The RNAs from each fraction of the polysome gradient were separated on 2% agarose-TBE gels. The positions of the 18S and 28S ribosomal RNAs are indicated. (D) Distribution on a 15–40% sucrose gradient of mRNAs coding for cyclin B (CycB, positive control) and initiation factor 4A (eIF4A, negative control) before (UnF) and after (F) fertilization. mRNAs were detected by RT-PCR amplification in each fraction (a representative experiment shown). Distribution of the mRNA along the gradient is shown as a percentage of total mRNA, error bars represent SEM on five biological replicates (UnF vs F: * P-value < 0.05). Presence of the mRNA in active polysomes was assessed by treating embryos in vivo with puromycin before polysome gradient fractionation (F+puro in vivo, n = 3). (E) Diagram of the translatome analysis, performed on three independent polysome profiling datasets.

