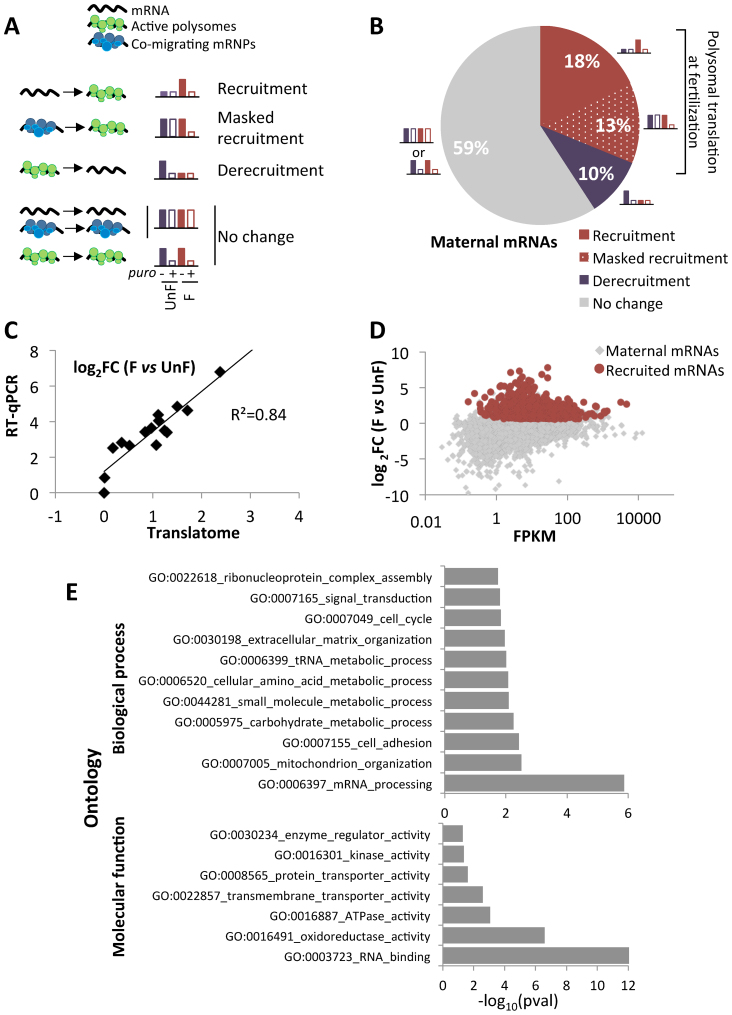
Figure 2.
(A) Schematic diagram of the different possible configurations of maternal mRNA upon fertilization. (B) Pie chart of maternal mRNAs according to their polysomal behavior just after fertilization as determined by the log2FC (F vs UnF), corrected by the puromycin control at both timepoints. (C) Comparison of log2FC values between unfertilized (UnF) and fertilized (F) polysomal mRNA for 15 genes obtained by RNA-Seq analysis (translatome) and by RT-qPCR. The best fitting linear regression is plotted. (D) Log2FC between F and UnF polysomal contents were plotted against the FPKM counts for each mRNA. All maternal mRNAs are shown in light gray, maternal mRNAs recruited upon fertilization are in red. (E) Functional categories and GOterms associated with the 18% recruited mRNAs. The numbers of transcripts obtained in the translated set for each category were compared with expected numbers assuming random representation (binomial test, P-value < 0.05). Bar charts represent the enriched biological processes (top) and molecular functions (bottom) associated with the translated mRNAs.

