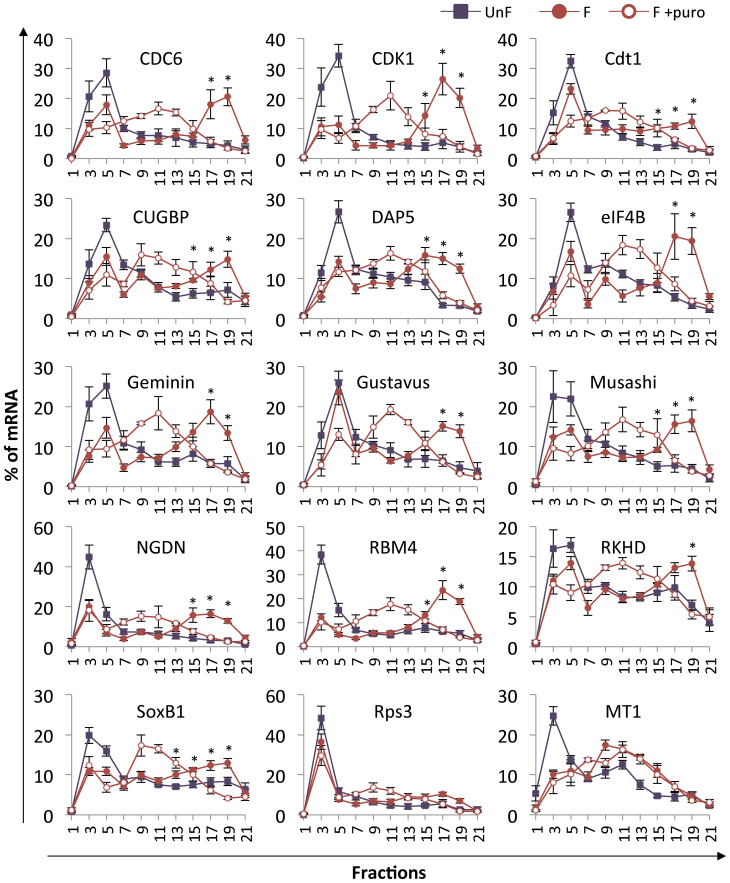
Figure 3.
Distribution on polysome gradients of selected mRNAs identified in the translatome analysis. mRNAs were detected by RT-PCR amplification in each fraction of the polysome gradient from unfertilized eggs (UnF), 1-h post-fertilization embryos (F) or puromycin-treated embryos (F+puro). Amplicons were run on agarose gels and quantified using ImageJ software. Distribution is shown along the gradient as a percentage of total mRNA. Fraction #1 corresponds to the top of the gradient (free mRNAs) and #21 corresponds to the bottom of the gradient. Values are shown as a mean of at least five independent biological replicates, error bars represent SEM (UnF vs F: *P-value < 0.05)

