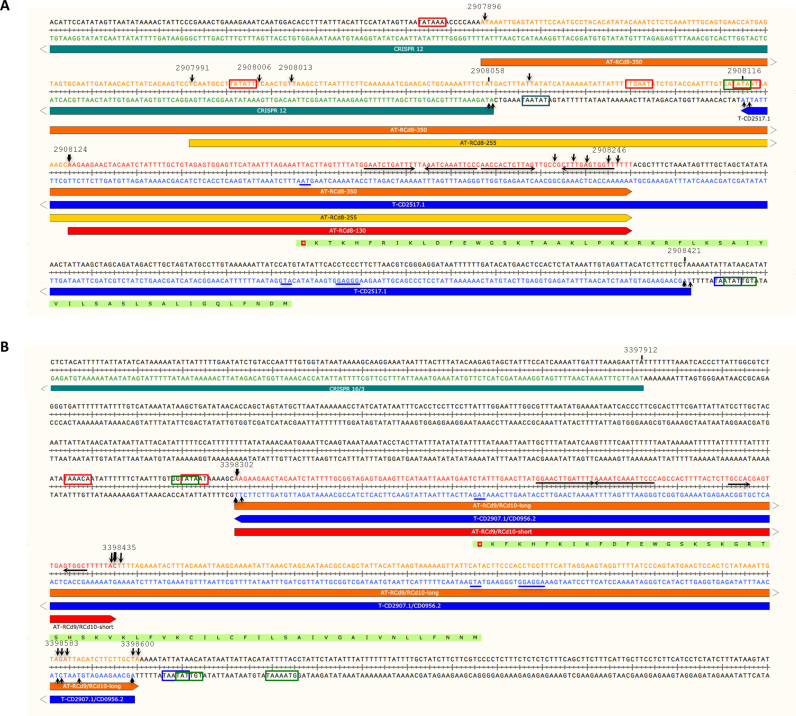
Figure 2.
Schematic representation of potential type I TA loci in C. difficile chromosome: (A) CRISPR 12 region, (B) CRISPR 16/15 (CRISPR 3/4) regions. The horizontal arrows below the double-stranded sequences show the toxin, antitoxin and CRISPR transcripts, the direction of transcription is indicated by arrowheads. The transcriptional start sites for sense and antisense transcripts identified by 5′/3′RACE and TSS mapping are indicated by vertical arrows with their genomic location. Line thickness corresponds to the proportion of observed extremities. The genomic location of 5′- and 3′-ends of the transcripts are indicated above the sequence. The inverted repeats at the position of transcriptional terminators are indicated by black arrows. The positions of Sigma A-dependent promoter −10 and −35 elements of antitoxin (AT) and toxin (T) are shown in boxes. The positions of ribosome binding site, translation initiation codon and stop codon of toxin (T) mRNA are underlined. The positions of Sigma B-dependent promoter elements are shown in boxes for both TA genes.

