Figure 2.
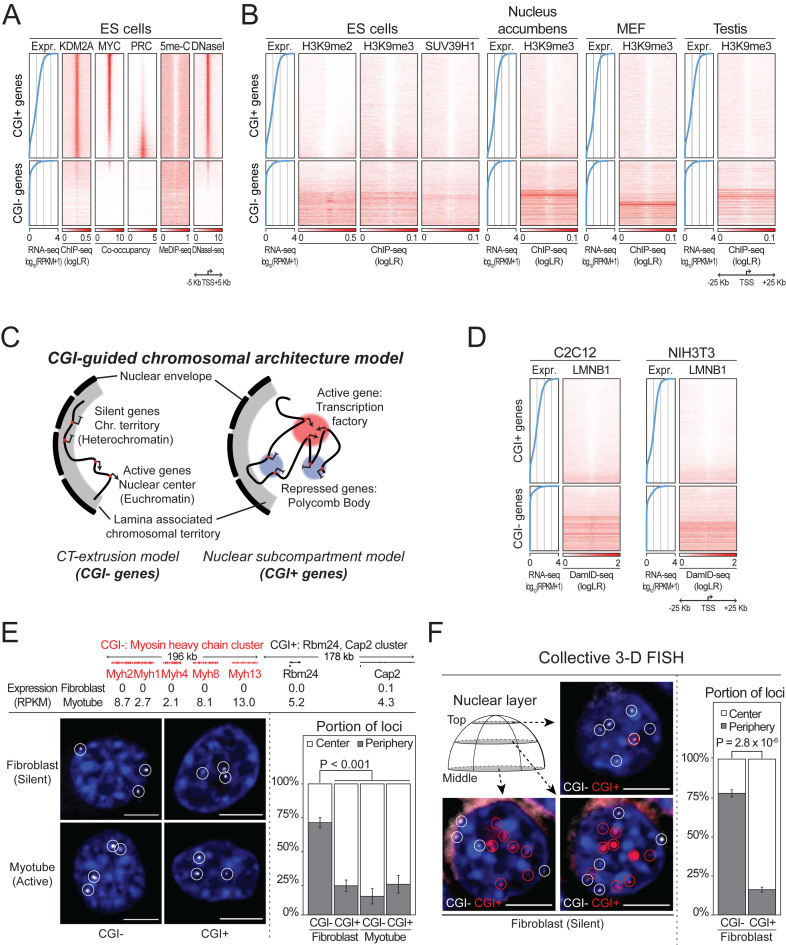
Spatial segregation of CGI+ and CGI− genes. (A) CGI-centered regulation mechanisms in CGI+ genes, and (B) heterochromatin features in CGI− genes. All protein coding genes are sorted by their expression values (left blue line plot), and the genomic landscape of promoter surrounding regions are shown. (C) CGI-guided chromosomal architecture model. (D) Association of peripheral nuclear lamina (LMNB1) with silent CGI− genes, but not CGI+ genes. (E) Localization of single CGI+ (or CGI−) gene cluster in fibroblasts and myotubes, and (F) multiple silent CGI+/CGI− gene clusters in fibroblasts (eight clusters each) determined by 3D FISH. Percentages of gene loci located in the nuclear center compared to the periphery in each cell are shown in bottom right. P-values: Wilcoxon signed-rank tests. Scale bar: 5 μm. Error bars show S.E.M.

