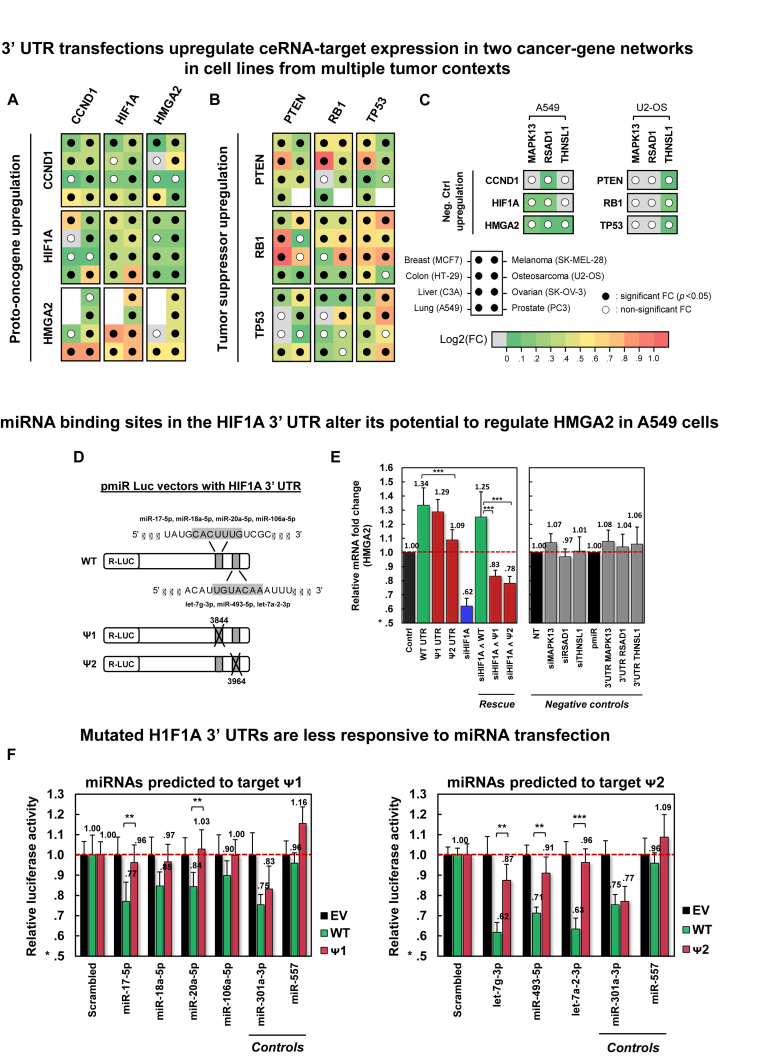
Figure 4.
Validation of oncogene and tumor-suppressor PCI subnetworks. Significant mRNA upregulation in response to 3′ UTR transfection of candidate PCI regulators in eight cell lines is shown for (A) a three-oncogene subnetwork and for (B) a three-tumor-suppressor subnetwork, and (C) negative controls. For each transfected 3′ UTR and each target gene, the panels identify cell lines where ceRNA targets were significantly (P < 0.05) upregulated in response to transfection (filled dots); missing dots designate cell lines where target expression was too low to be measured. Fold changes are depicted by a green-to-red log-scale gradient, with red showing a 2-fold change; fold change values are given in Supplementary Figures S8-S10. (D) Deletions of 7-base predicted miRNA binding sites were used to generate HIF1A 3′ UTR (WT) mutants (Ψ1 and Ψ2); deletions at Ψ1 and Ψ2 start at positions 3844 and 3964 of NM_001530, respectively. (E) Transfections of constructs containing Ψ1 and Ψ2 had weaker HMGA2 upregulation and rescue by HIF1A silencing, compared to WT constructs. Negative controls include perturbations of MAPK13, RSAD1 and THNSL1. (F) Luciferase activity fold changes of constructs containing WT, Ψ1, and Ψ2 after transfecting miRNAs predicted to modulate HMGA2 regulation and target deleted sites. The region deleted in Ψ1 was predicted to bind miR-17-5p, miR-18a-5p, miR-20a-5p and miR-106a-5p; Ψ2 lost a predicted binding site for let-7g-3p, miR-493-5p and let-7a-2-3p; miR-301a-3p was predicted to target WT, Ψ1 and Ψ2; and miR-557 was not predicted to regulate HIF1A. Notations ** and *** denote P< 0.01 and P< 0.001, respectively. Data are represented as mean ± SEM.

