Figure 2.
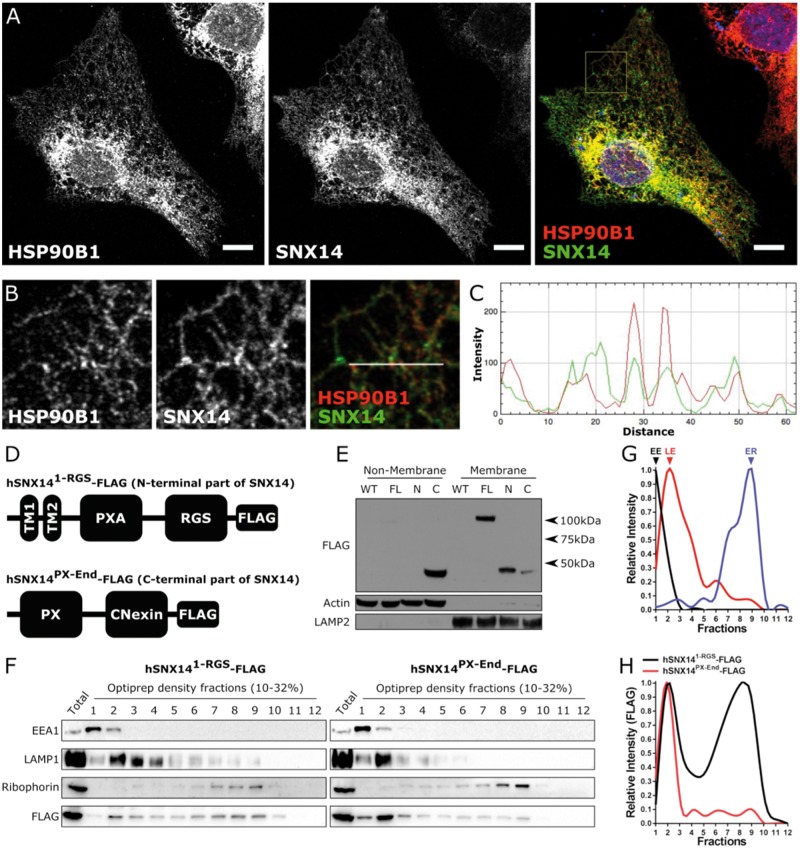
SNX14 is localized to the endoplasmic reticulum membrane. (A, B) Overexpressed SNX14 in U2OS cells display a similar subcellular distribution to ER associated HSP90B1 (Scale bar = 10 µm). (C) Line plot of the region designated in (B) showing the relationship between SNX14 (Green) and HSP90B1 (Red) intensity. (D) U2OS cell lines express either N- or C-terminal segments of SNX14-FLAG. (E) The N-terminal segment of SNX14-FLAG is predominantly responsible for membrane association. (F) Organelle fractionation reveals different distributions between N- and C-terminal SNX14 segments. (G) Relative intensity of early endosome (EE) associated EEA1, late endosome (LE) associated LAMP1 and endoplasmic reticulum (ER) associated Ribophorin of hSNX141-RGS-FLAG expressing U2OS cells. (H) Relative intensity profile of N- and C-terminal segments of SNX14 show different distribution profiles.

