Figure 2.
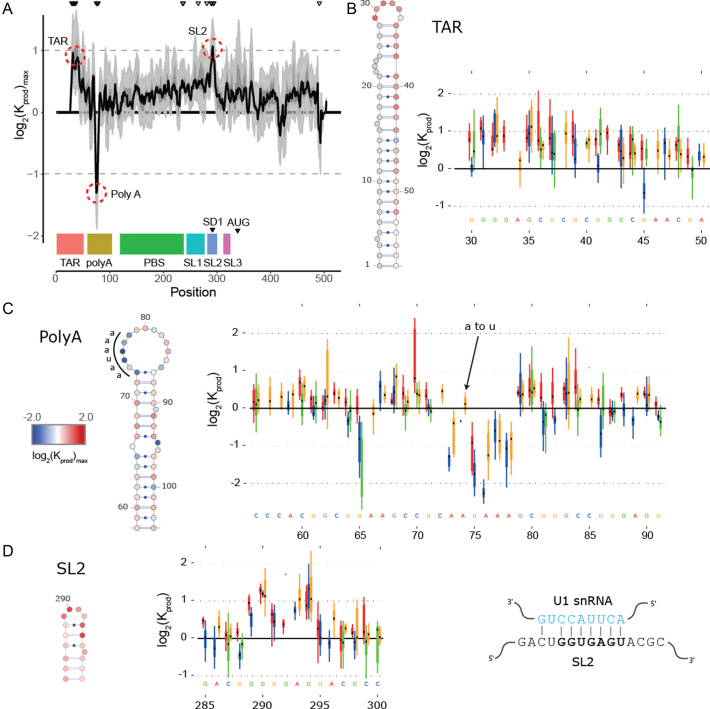
In cell Mutational Interference Mapping Experiment (in cell MIME) discovery of RNA motifs regulating HIV-1 gRNA production (A) Log2 Kprod showing the maximal effect of mutations on RNA production in cells with the HIV-1 5′ UTR and Gag coding region (smoothed with a linear, two-sided convolution filter of width 2). Functional domains are indicated with coloured boxes below the graph. Positions with significant effects on RNA production are indicated by black triangles above the graph. Three regions with significant (P < 0.05) and strong (log2 Kprod ≥ 1 or ≤ –1; gray dotted line) effects on gRNA production are highlighted with red circles. (B to D) Mutations with maximal effect on log2 Kprod mapped on RNA structure. Positions impairing RNA production are shown in red. Positions improving RNA production shown in blue. Box and whisker plots show effect of each class of mutation on log2 Kprod. Black dot shows median, box shows quartiles (25% and 75%) and whiskers show extremes (excluding outliers beyond 1.5× IQR). Mutation classes are colour coded: red mutated to A; green mutated to C; blue mutated to G; yellow mutated to U. (B) Effect of mutations on gRNA production (log2 Kprod) mapped to TAR. (C) Effect of mutations on gRNA production (log2 Kprod) mapped to 5′ PolyA. All mutations to AAUAAA sequence improve gRNA production except for a single A to U mutation. (D) Effect of mutations on gRNA production (log2 Kprod) mapped to SL2. Mutations impairing gRNA production cluster to the U1 snRNA binding site.

